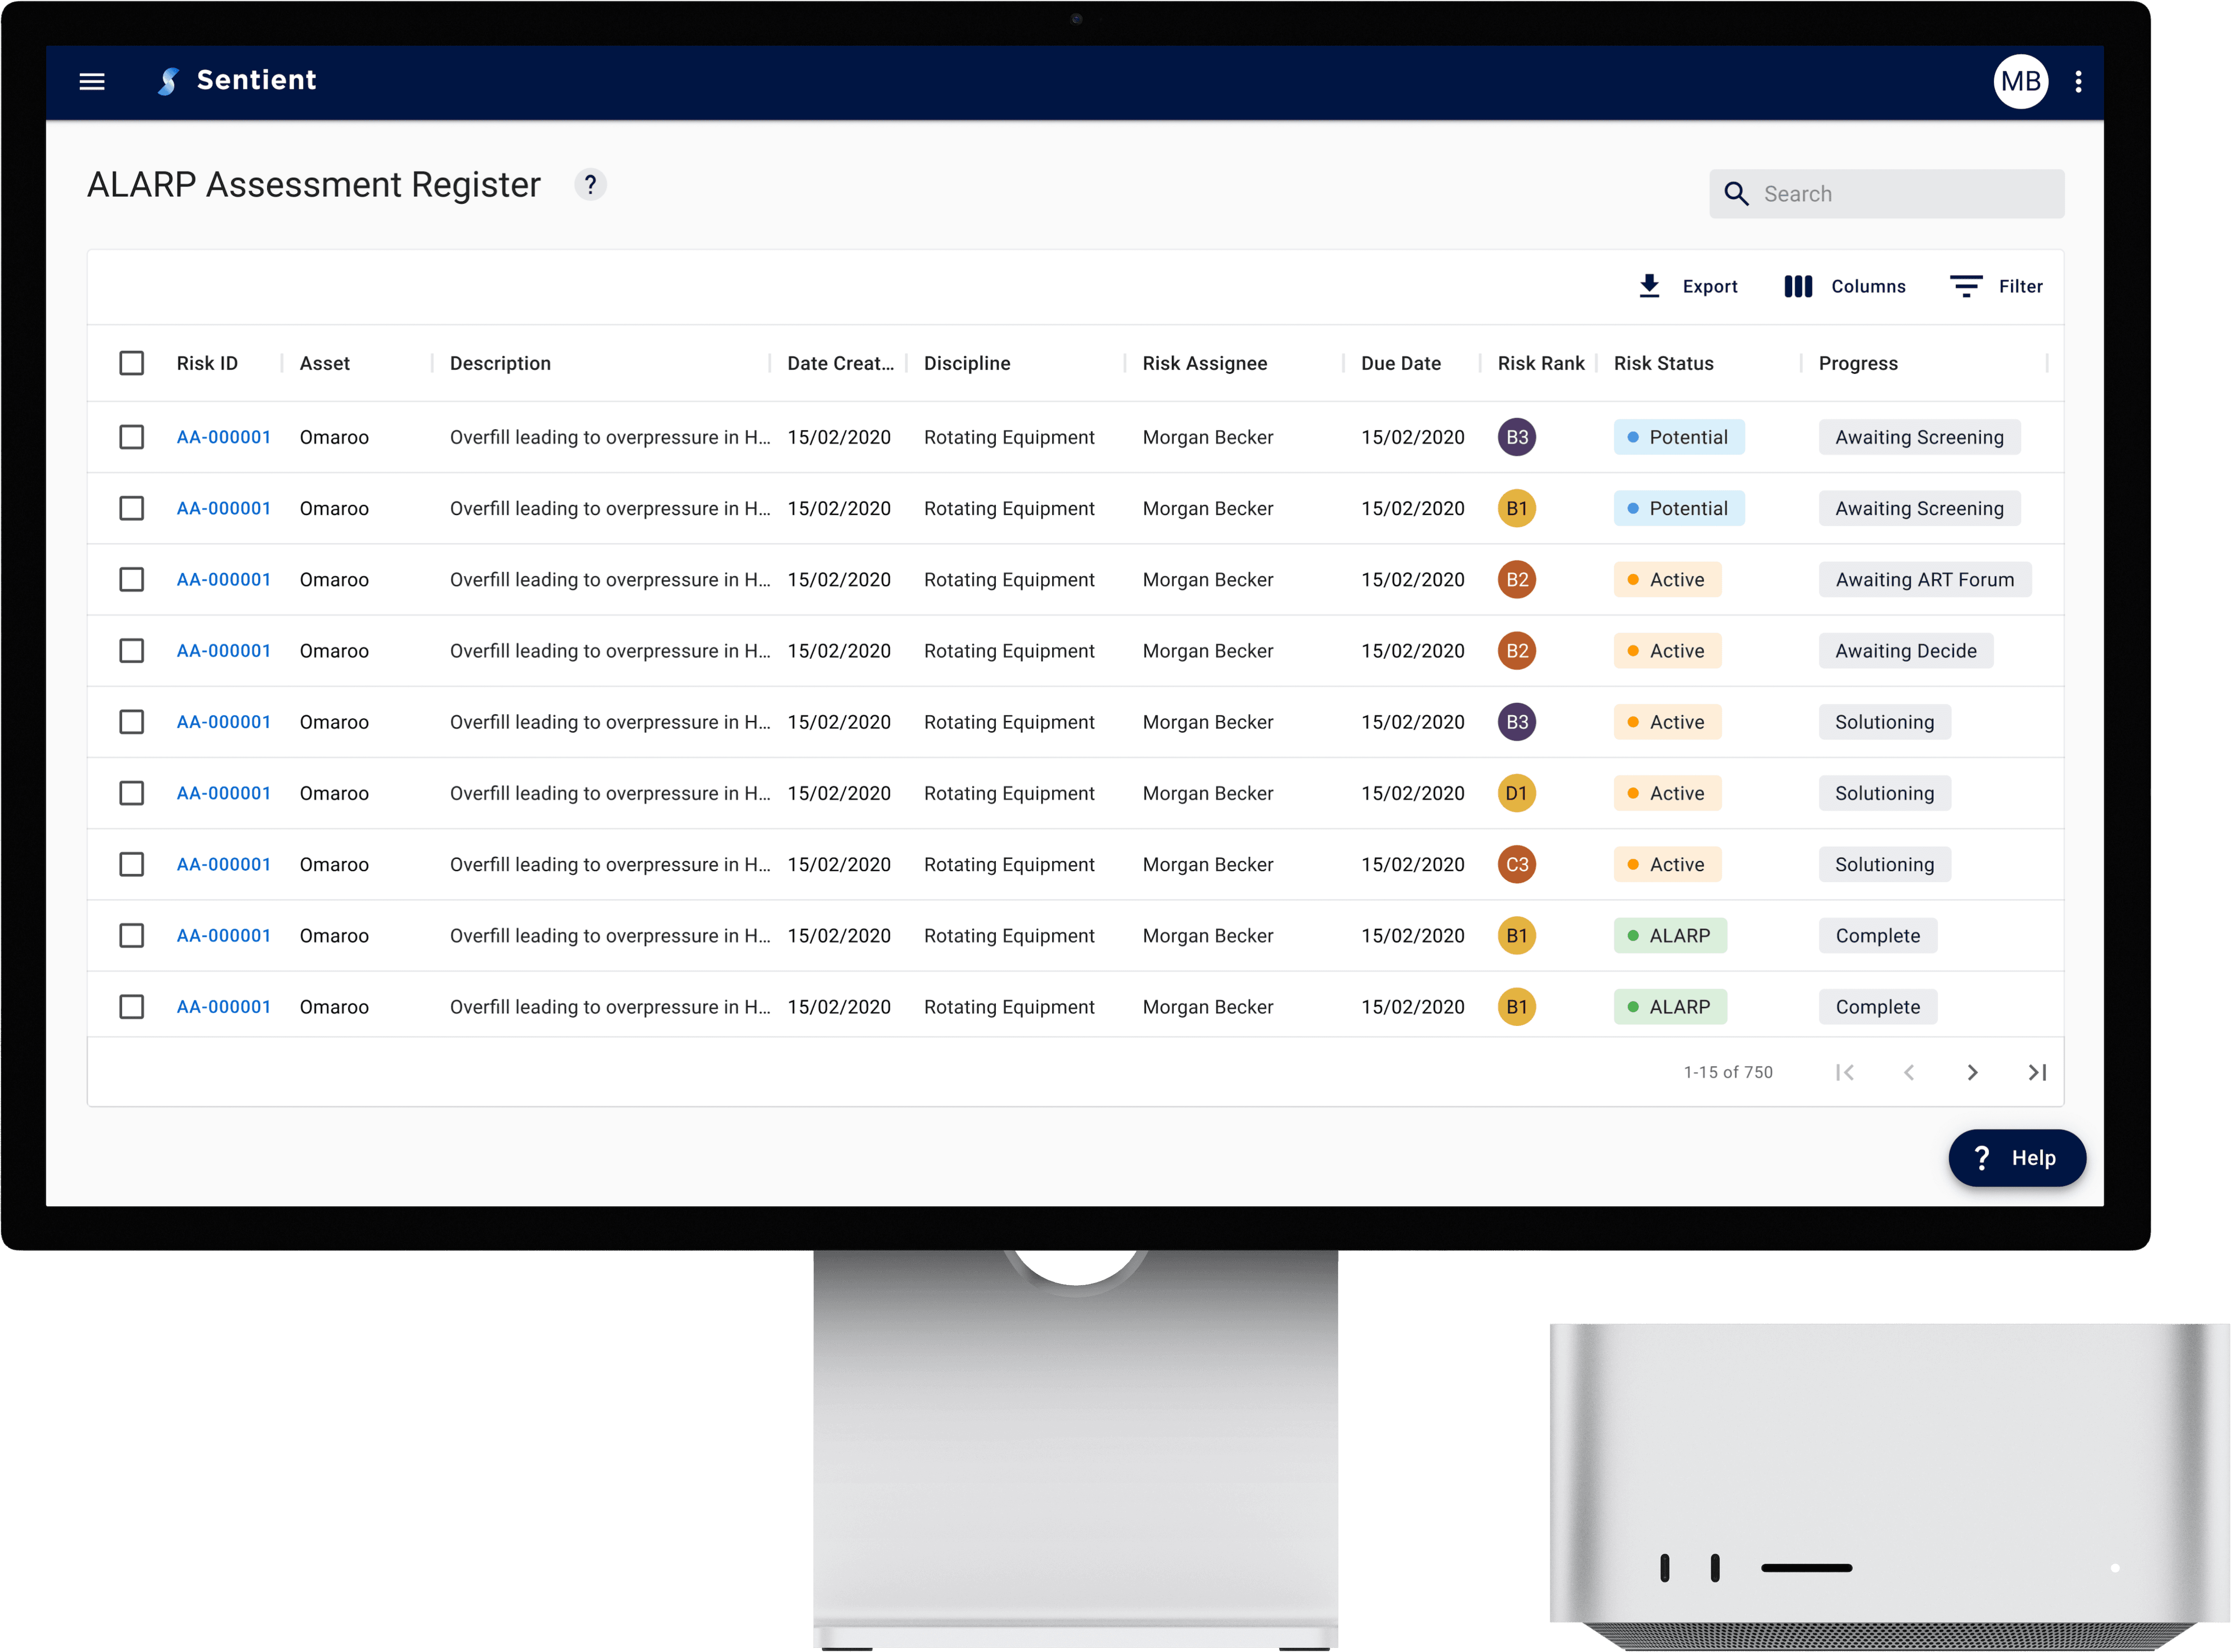
A Risk management framework for safer decision making
Guiding engineers through a structured approach to identify, assess, & prioritise risks to make less conservative decisions.
Confidential
9 months
Oil & Gas
Product Owner
3 in-house developers
Workflow Designer
Jr Service Designer
Process Safety Eng
Scrum Master
System Architect
Change Manager
Value Engineer
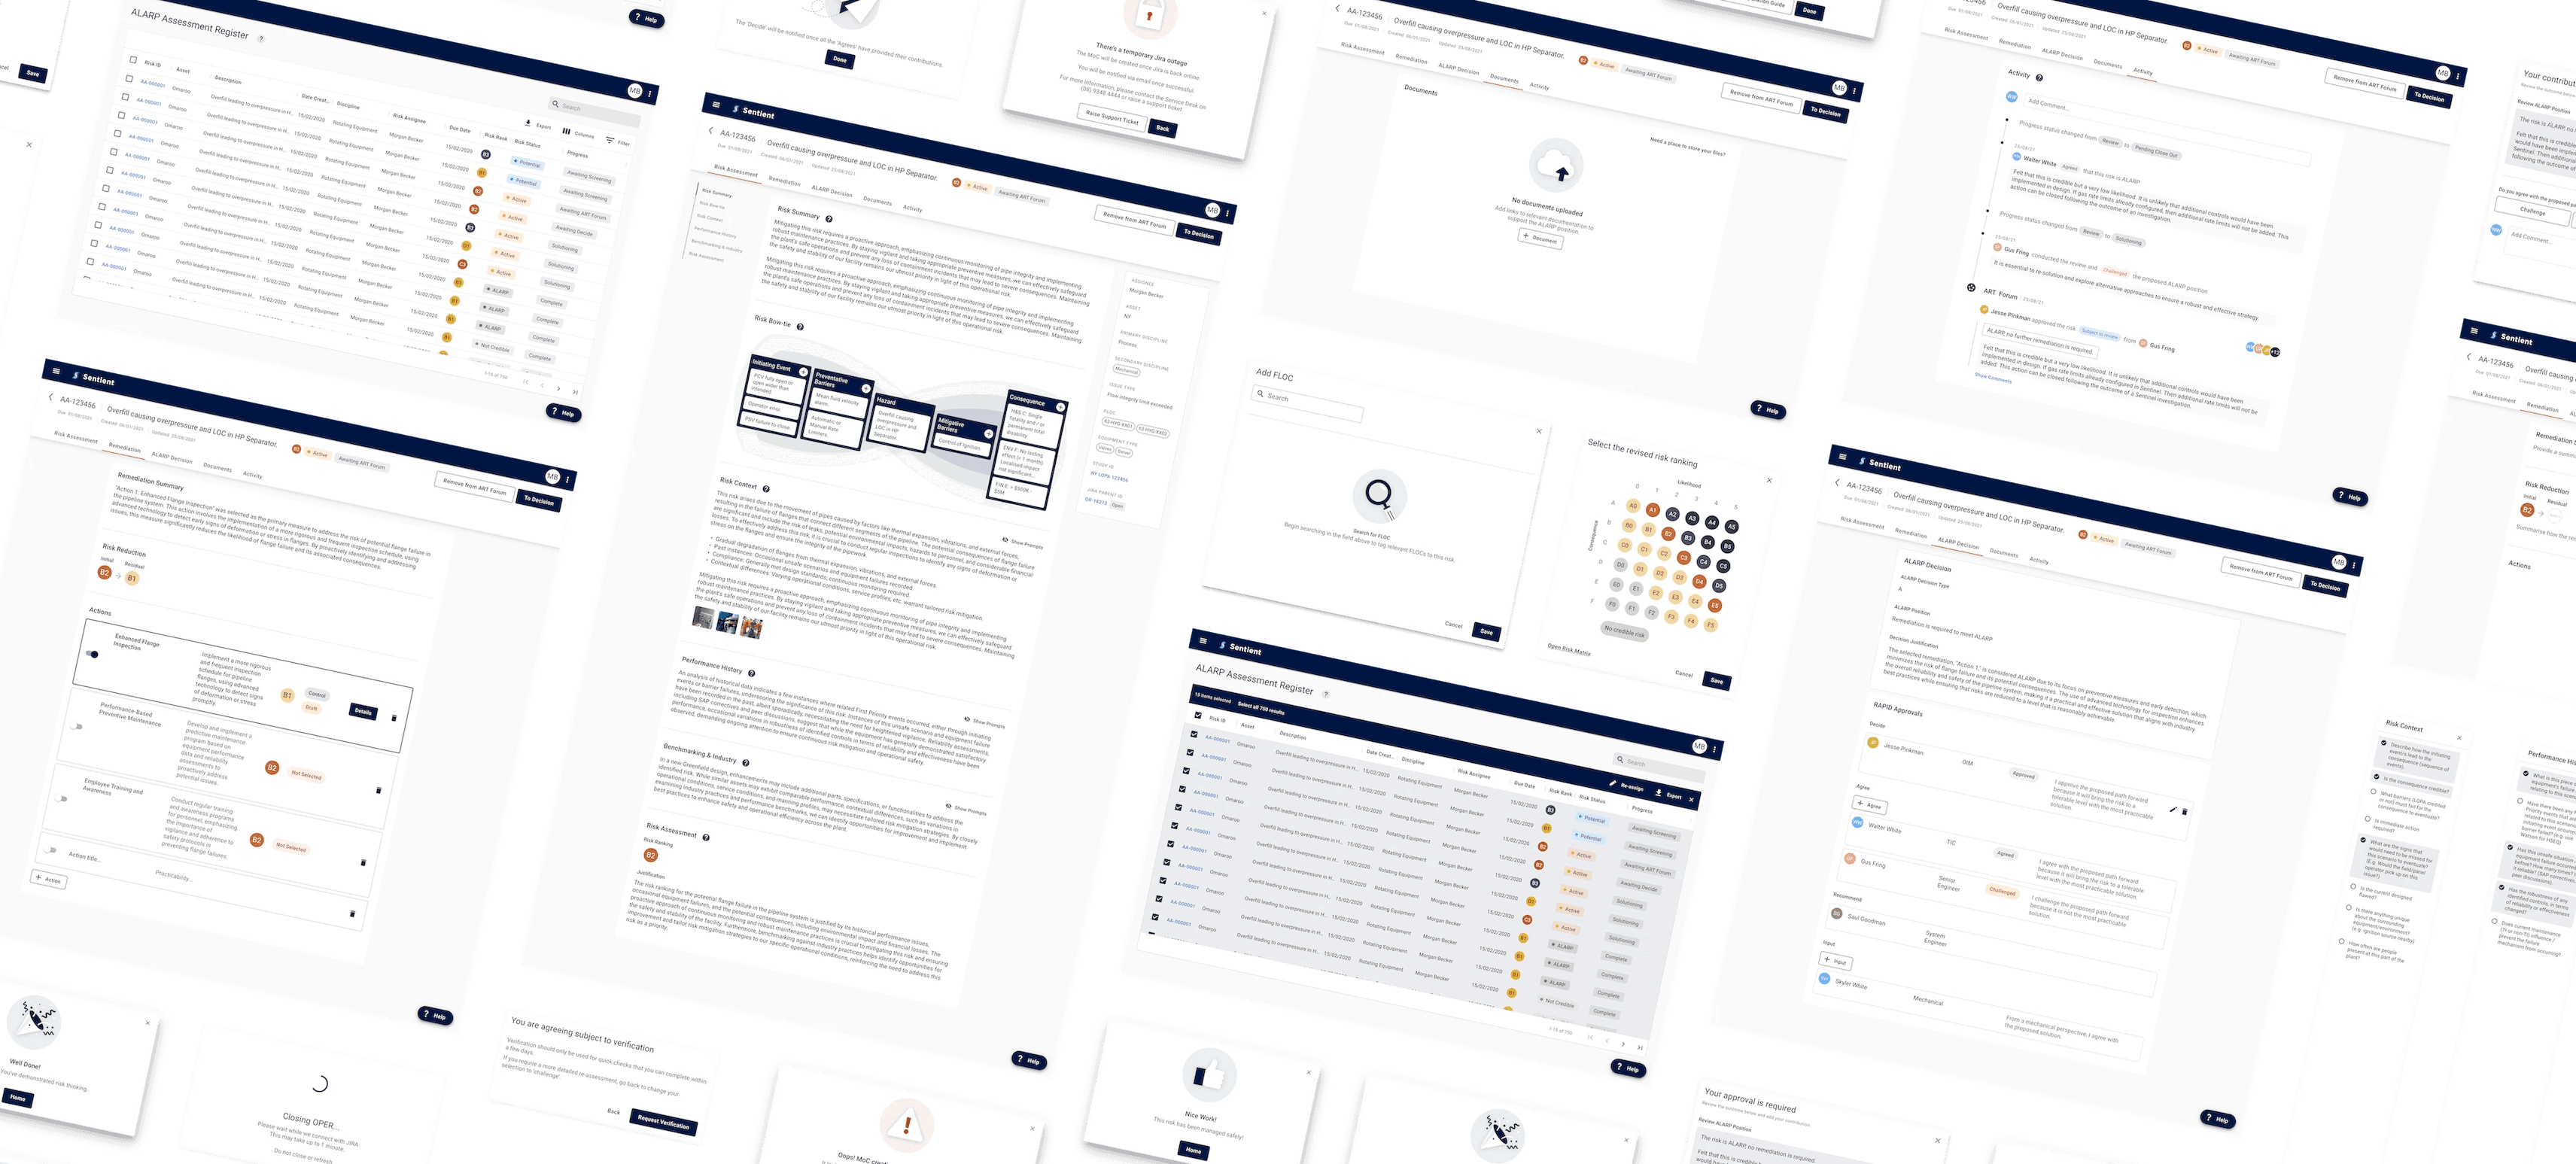
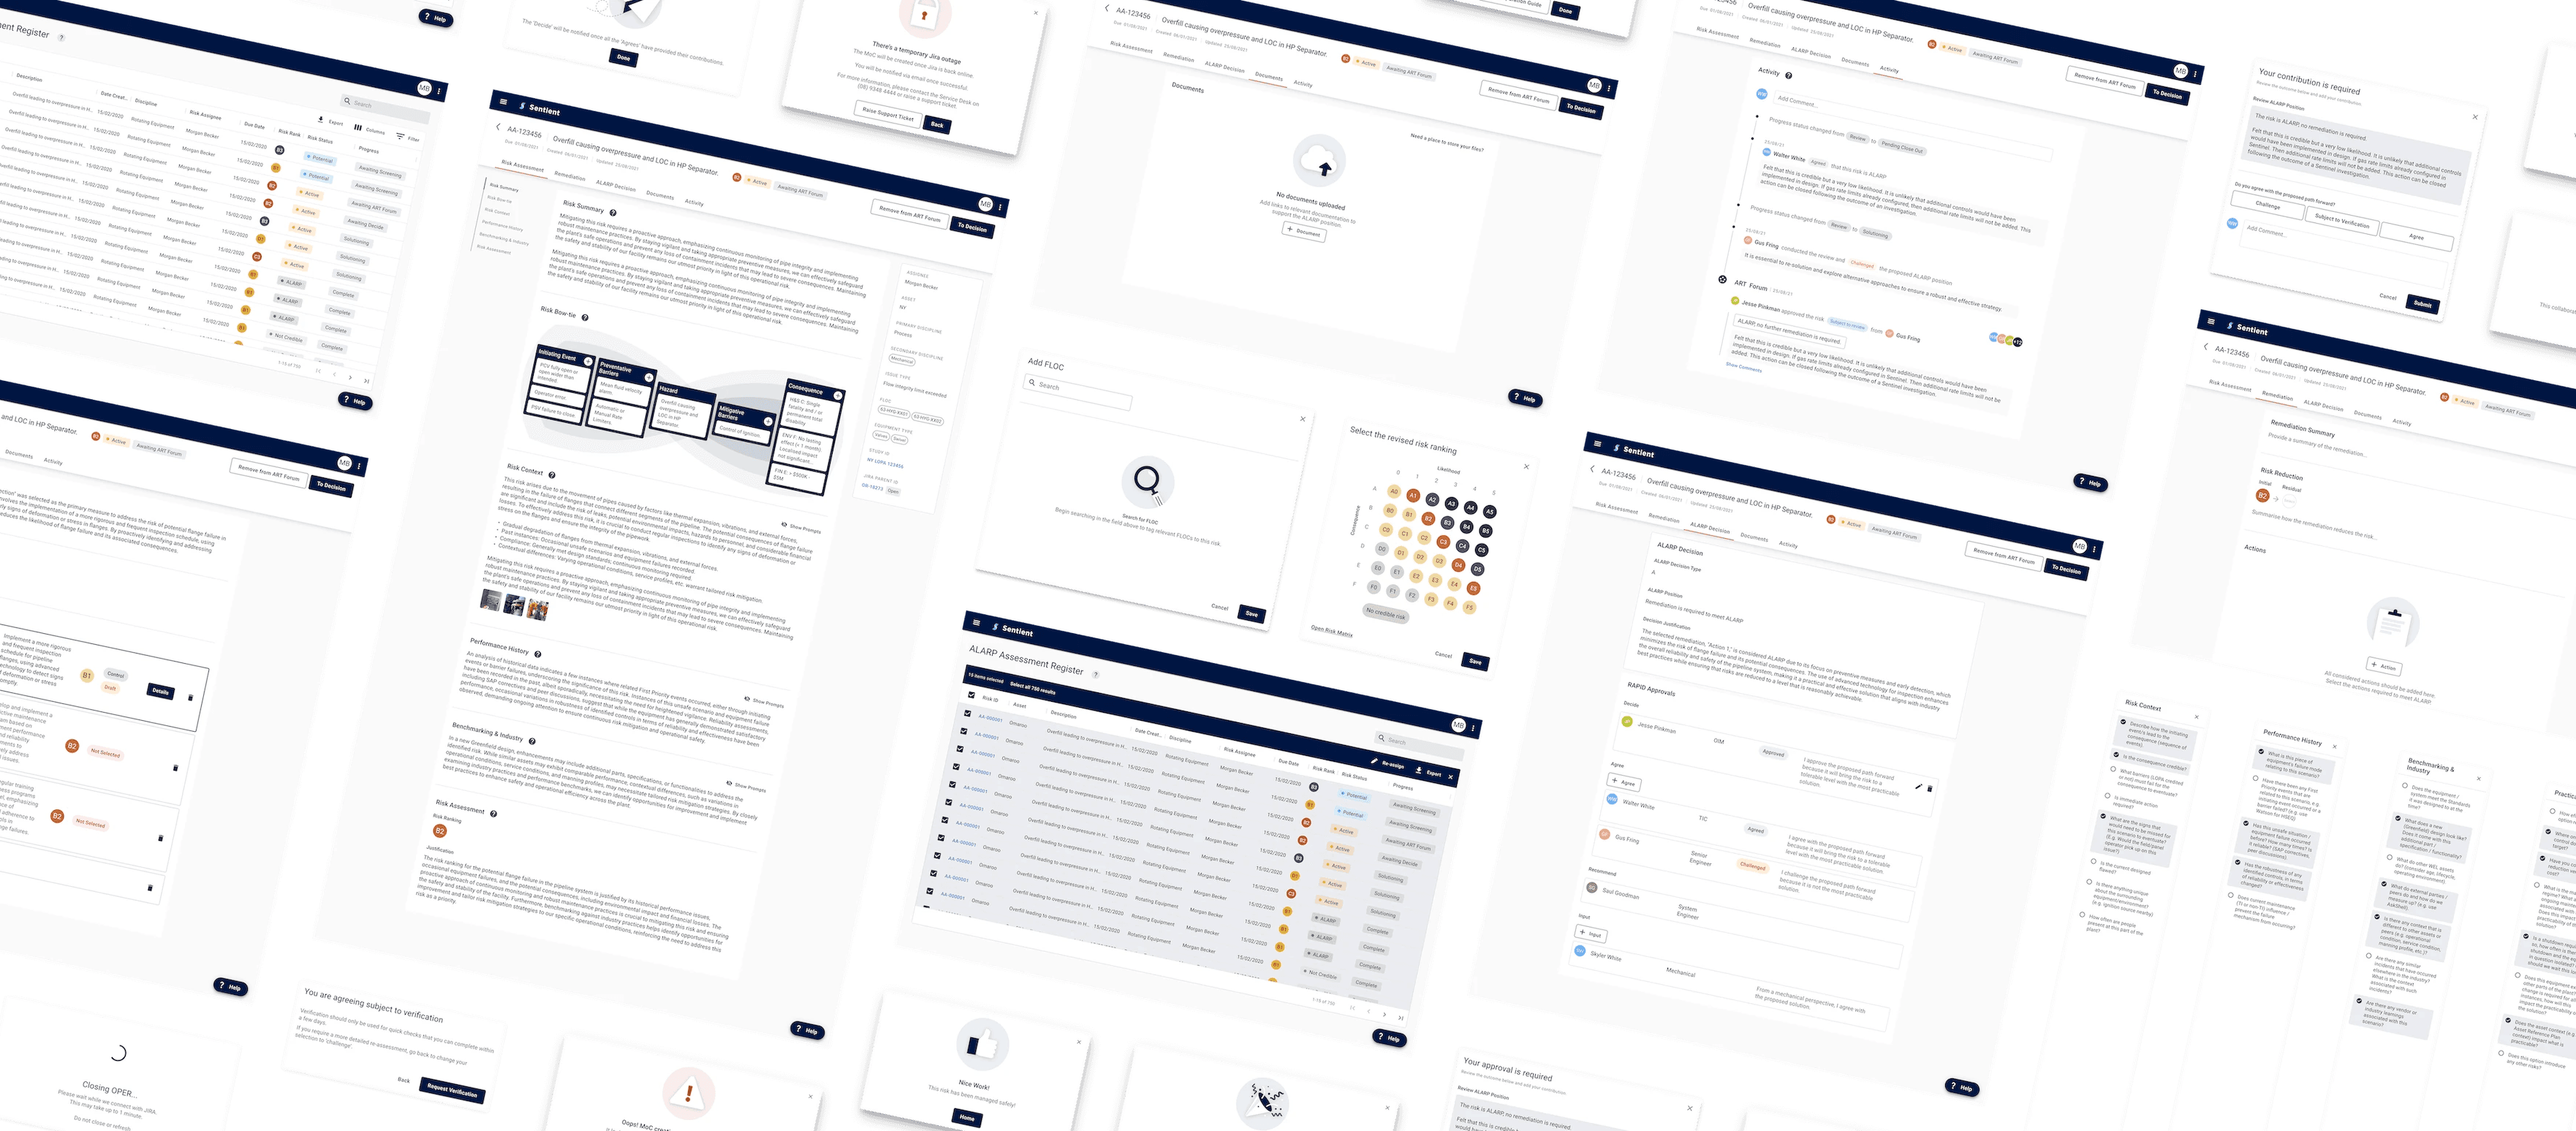
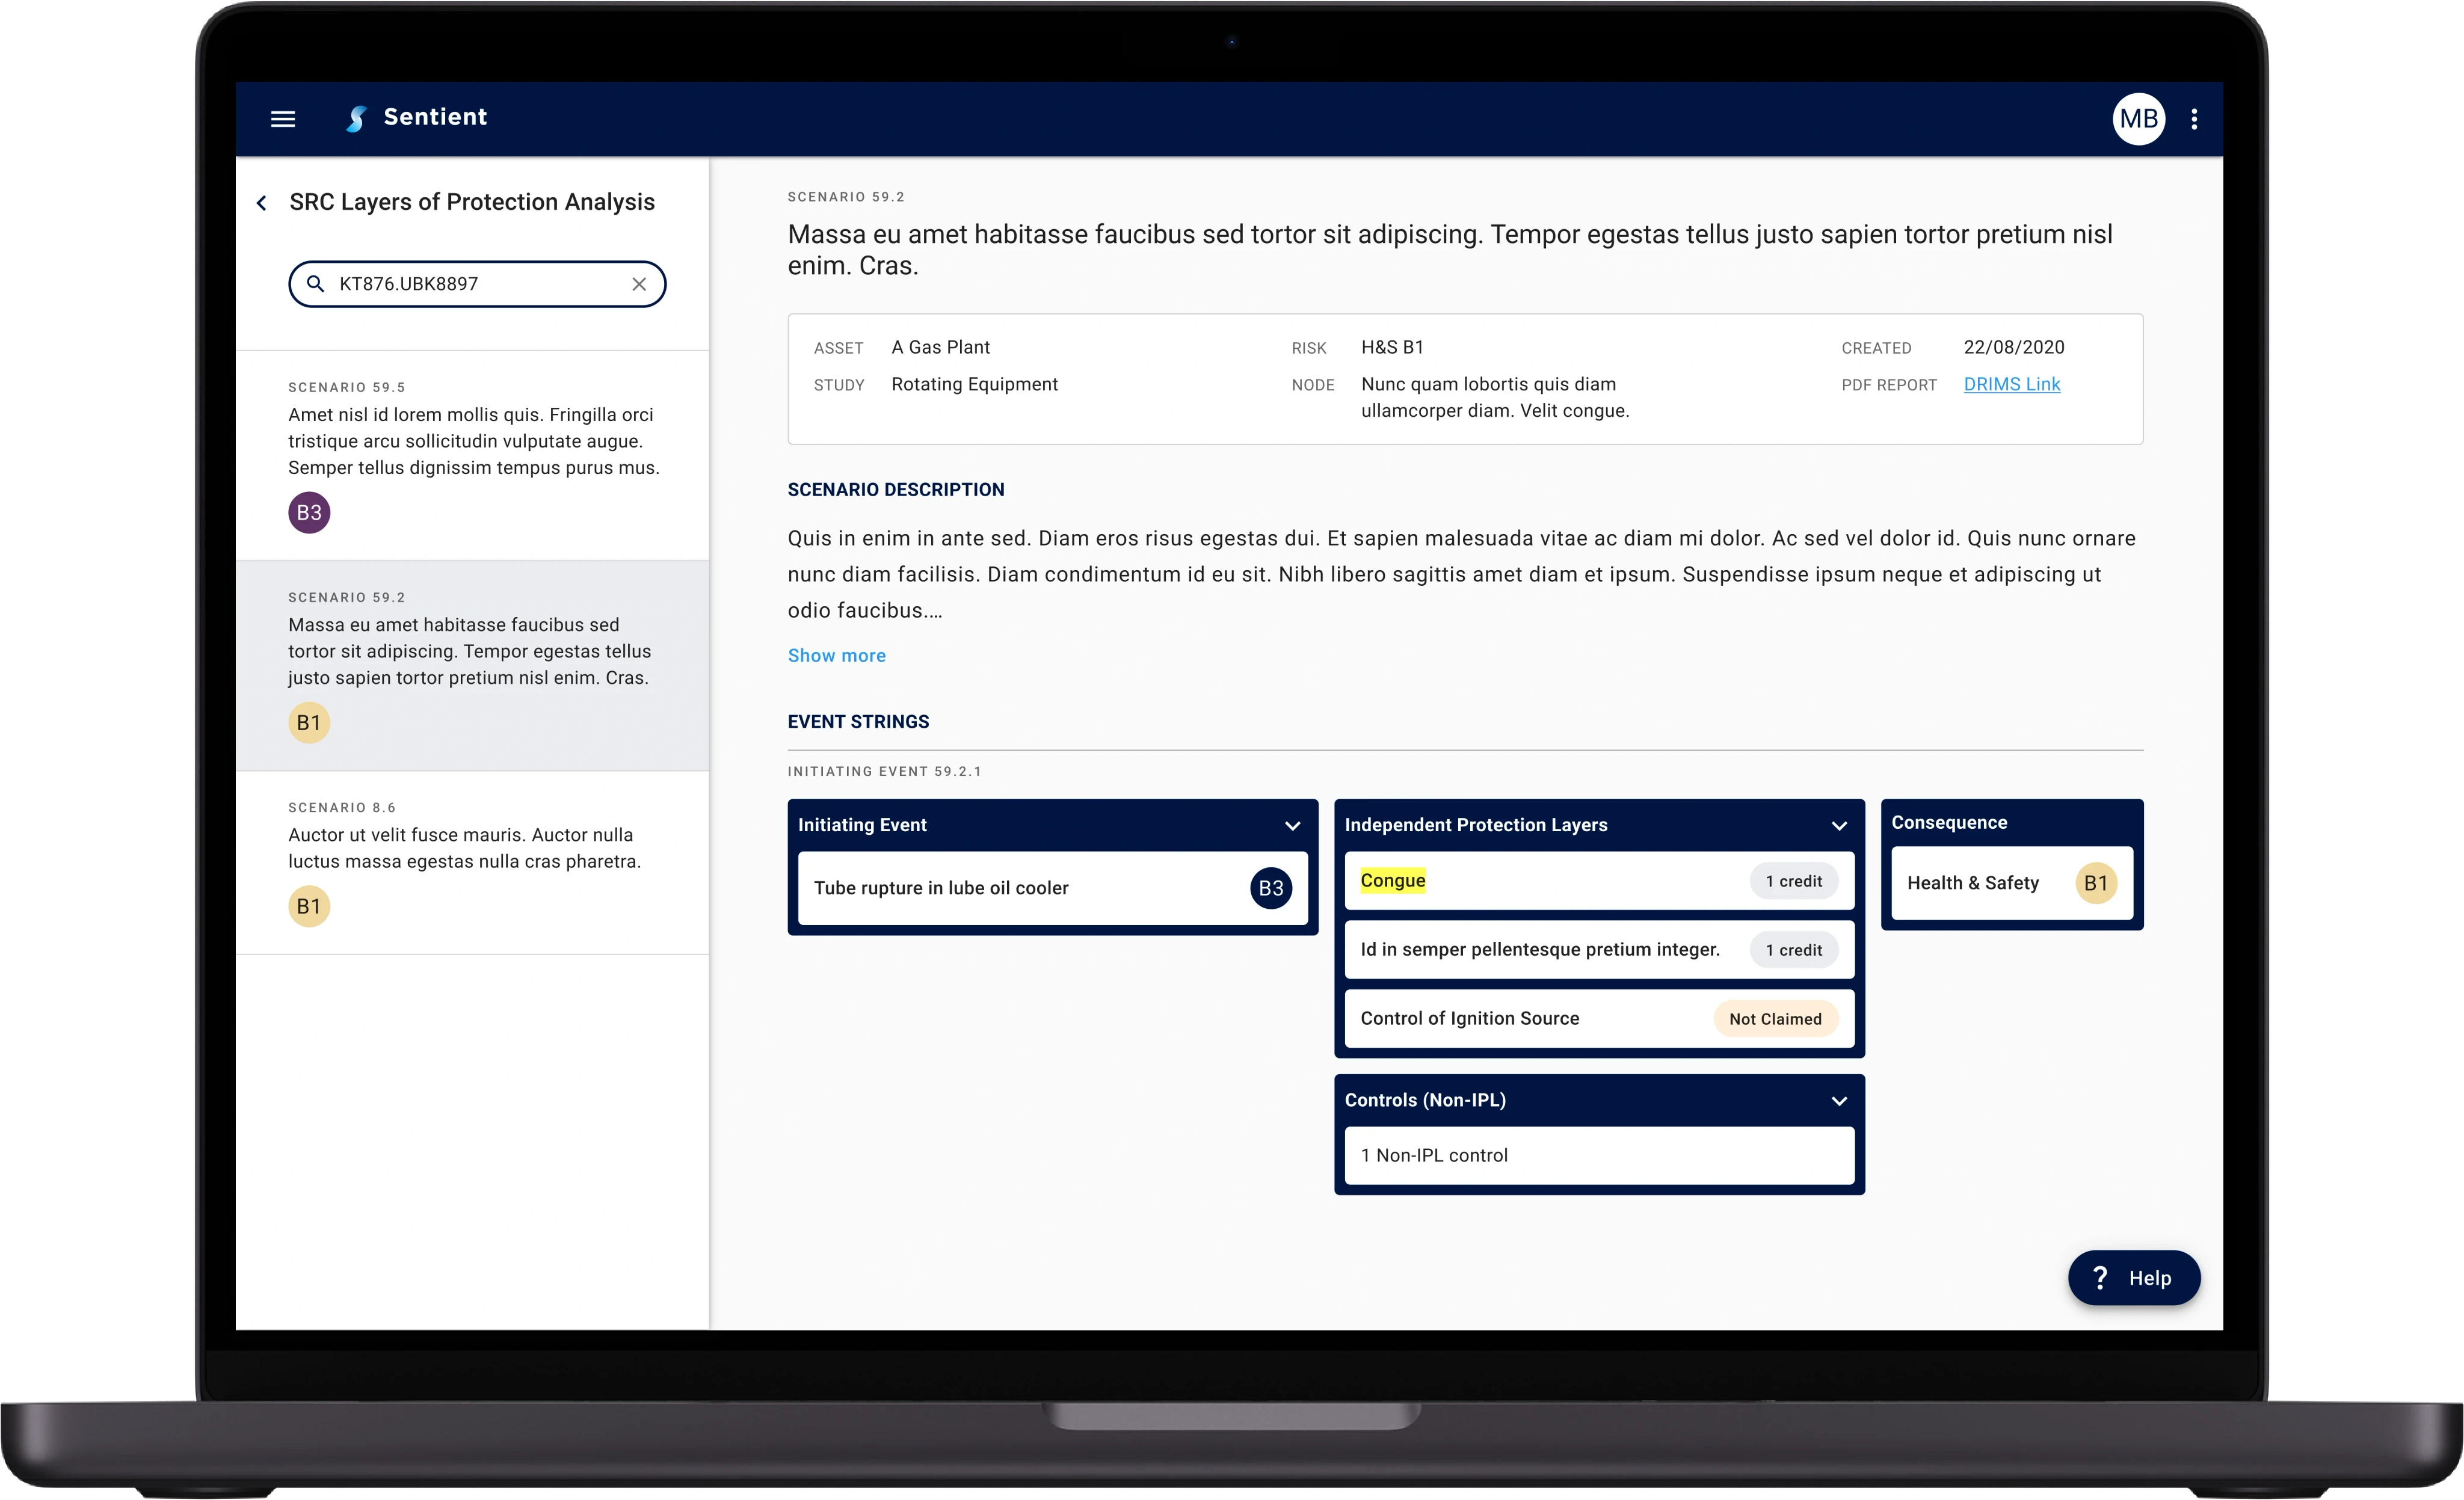
A web-app, combined with a new training framework & process for making risk management decisions.
The web-app aimed to guide engineers through the decision making process.
Discovery
Verken onze projectenportefeuille en zie de invloed van onze ontwerp- en merkbenaderingen in actie.
Verken onze projectenportefeuille en zie de invloed van onze ontwerp- en merkbenaderingen in actie.
Verken onze projectenportefeuille en zie de invloed van onze ontwerp- en merkbenaderingen in actie.
Verken onze projectenportefeuille en zie de invloed van onze ontwerp- en merkbenaderingen in actie.
Verken onze projectenportefeuille en zie de invloed van onze ontwerp- en merkbenaderingen in actie.
Verken onze projectenportefeuille en zie de invloed van onze ontwerp- en merkbenaderingen in actie.
Verken onze projectenportefeuille en zie de invloed van onze ontwerp- en merkbenaderingen in actie.
Verken onze projectenportefeuille en zie de invloed van onze ontwerp- en merkbenaderingen in actie.
What we found…
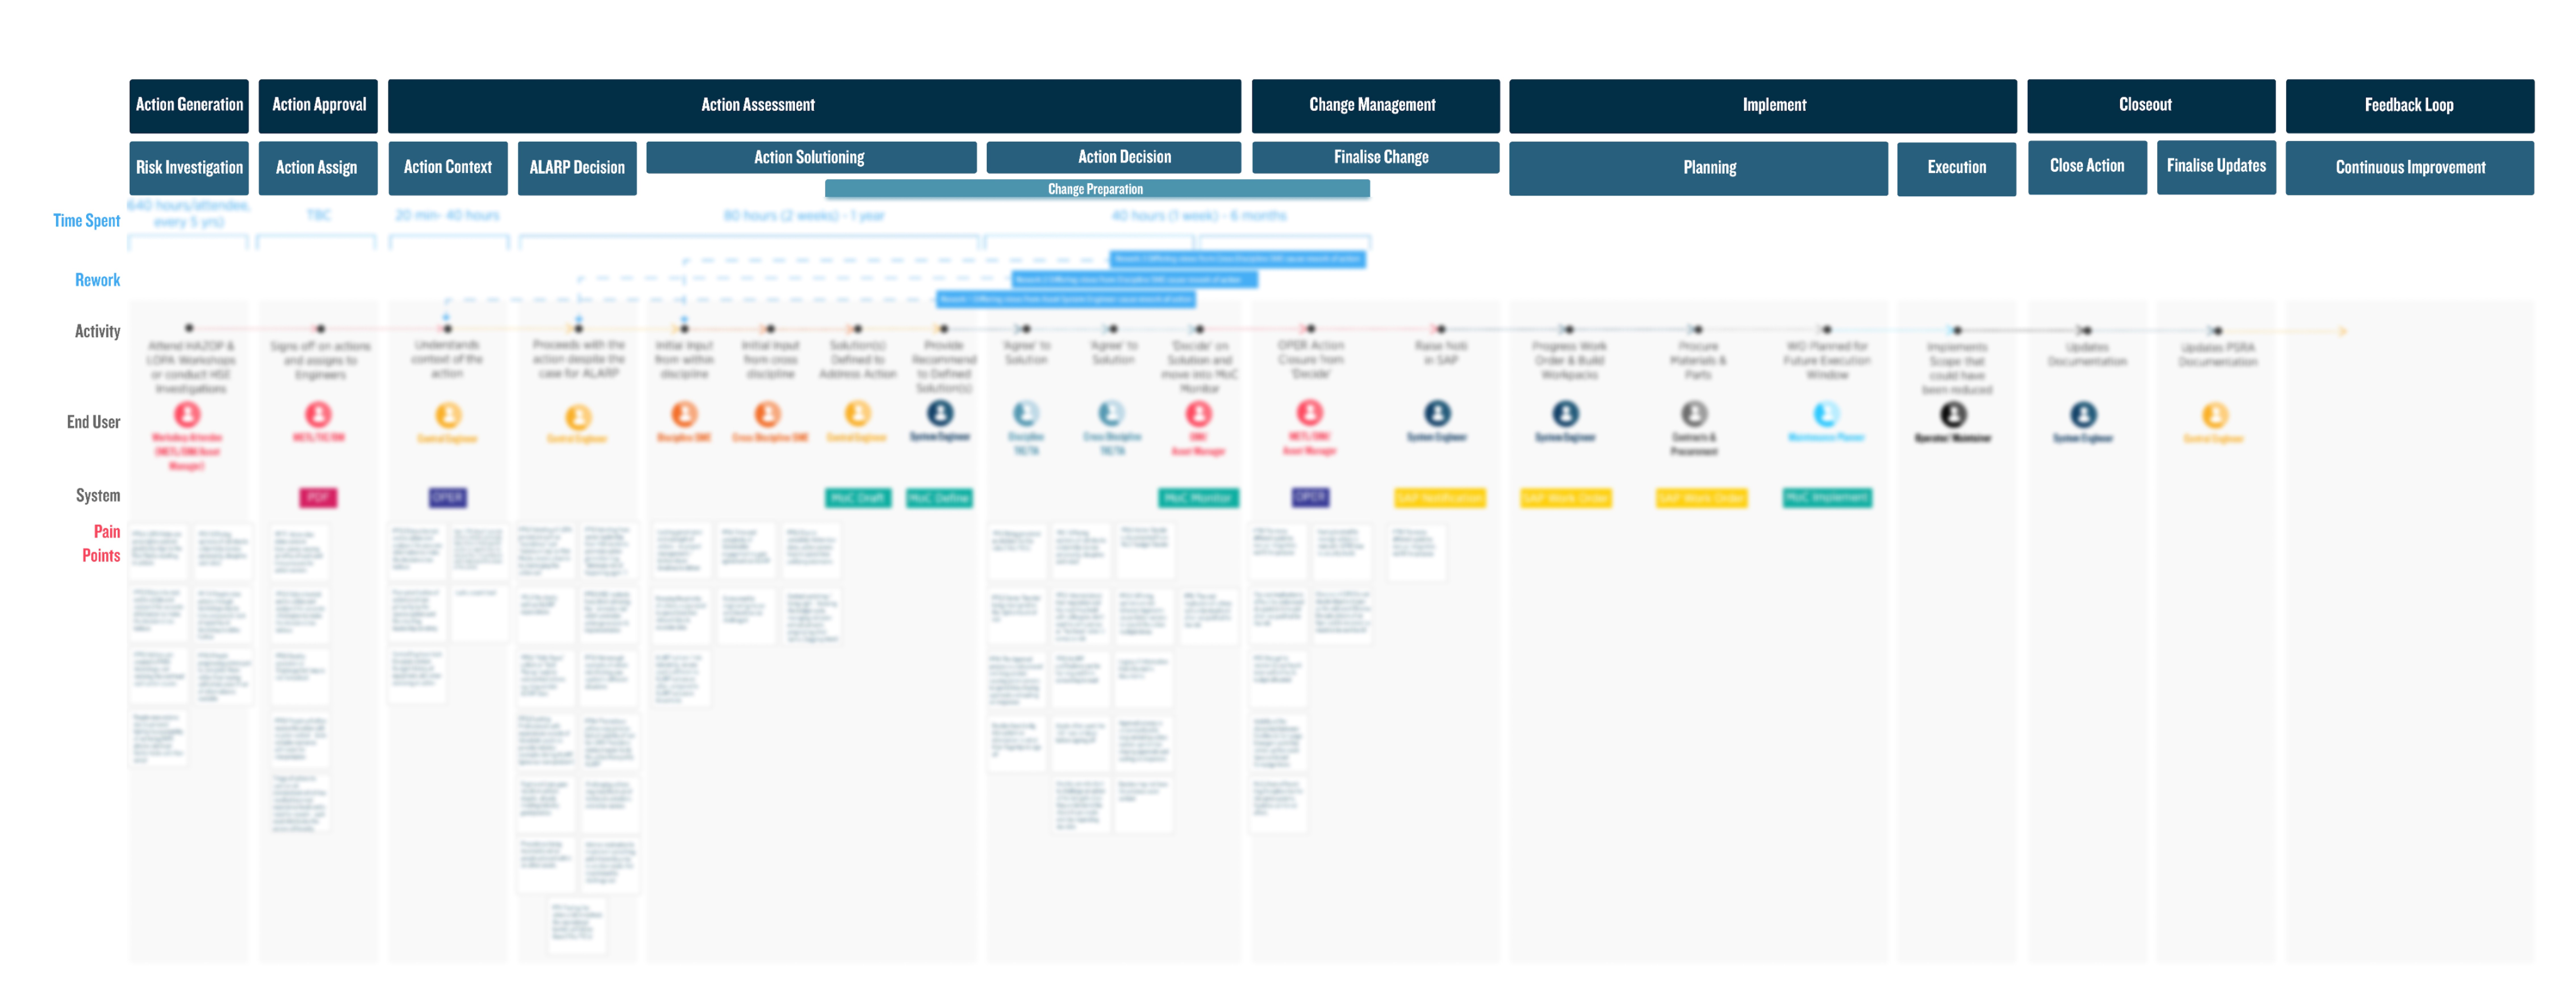
Current State Map
The draft current state was built collaboratively with our SME & design team then validated, built upon & refined during research activities.
We developed one that focused on high level steps, time frames & key pain points; & another that went into more detail.
Current State User Journey Map — Images blurred for confidentiality
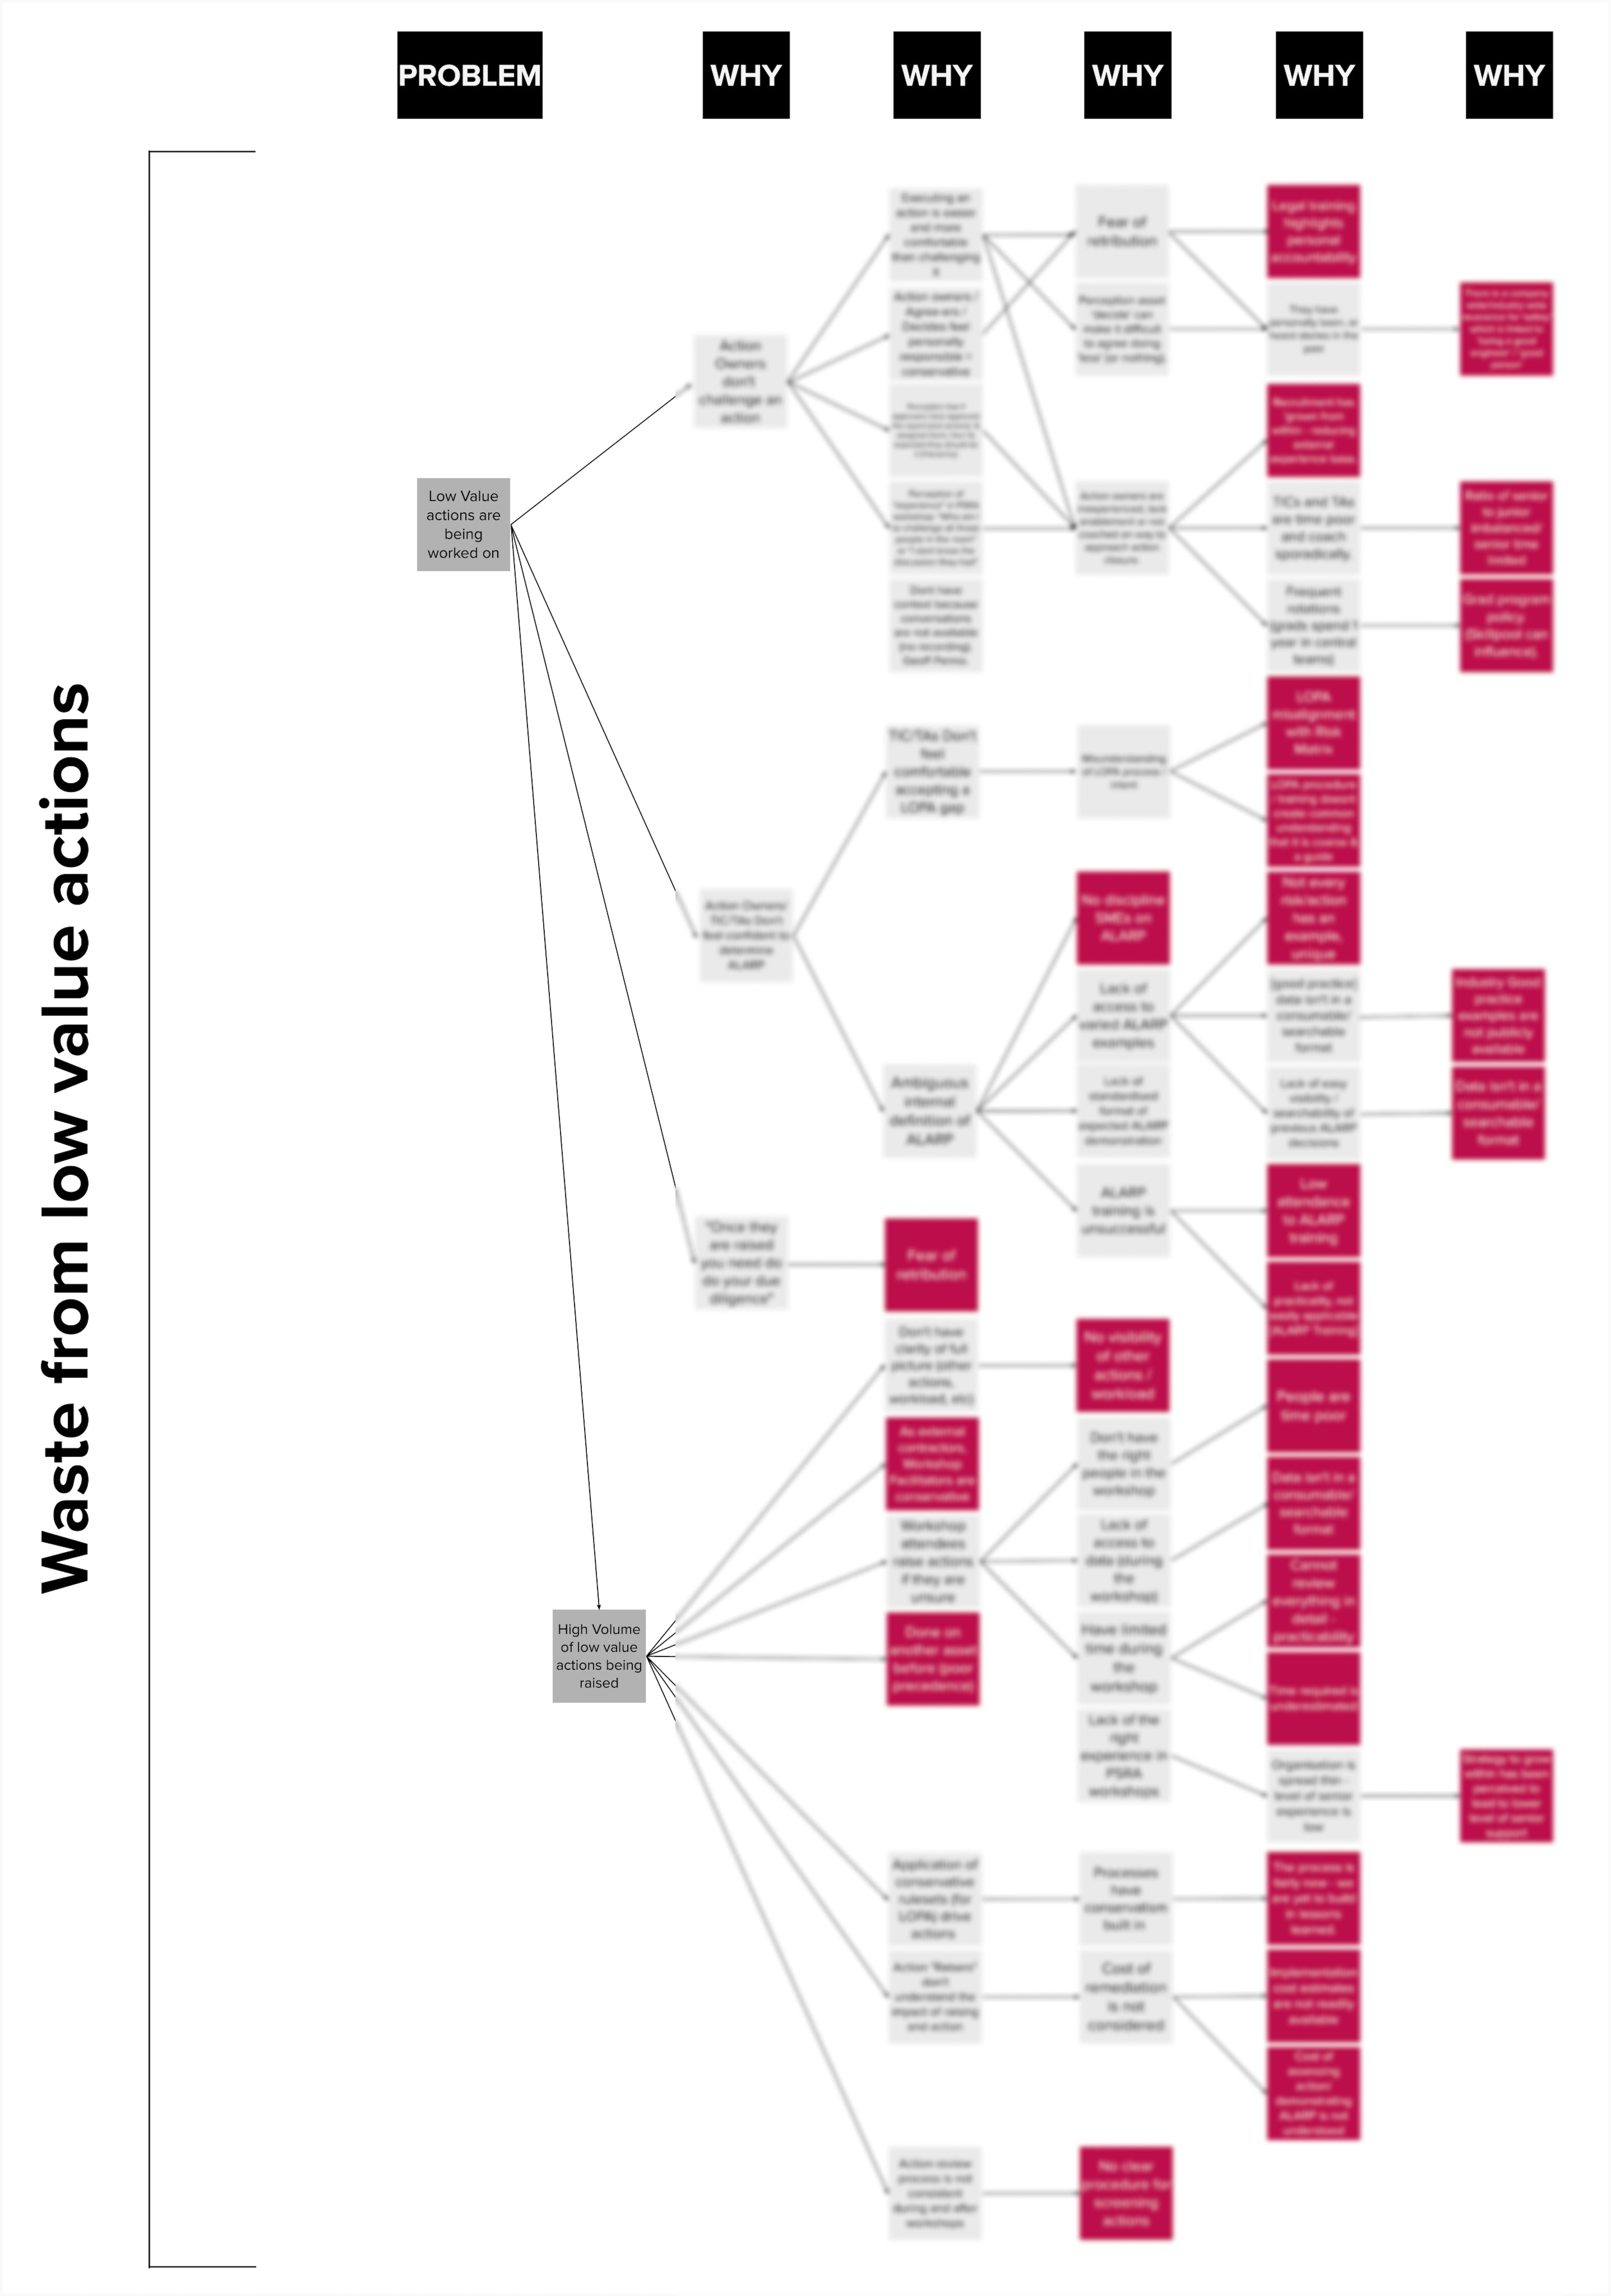
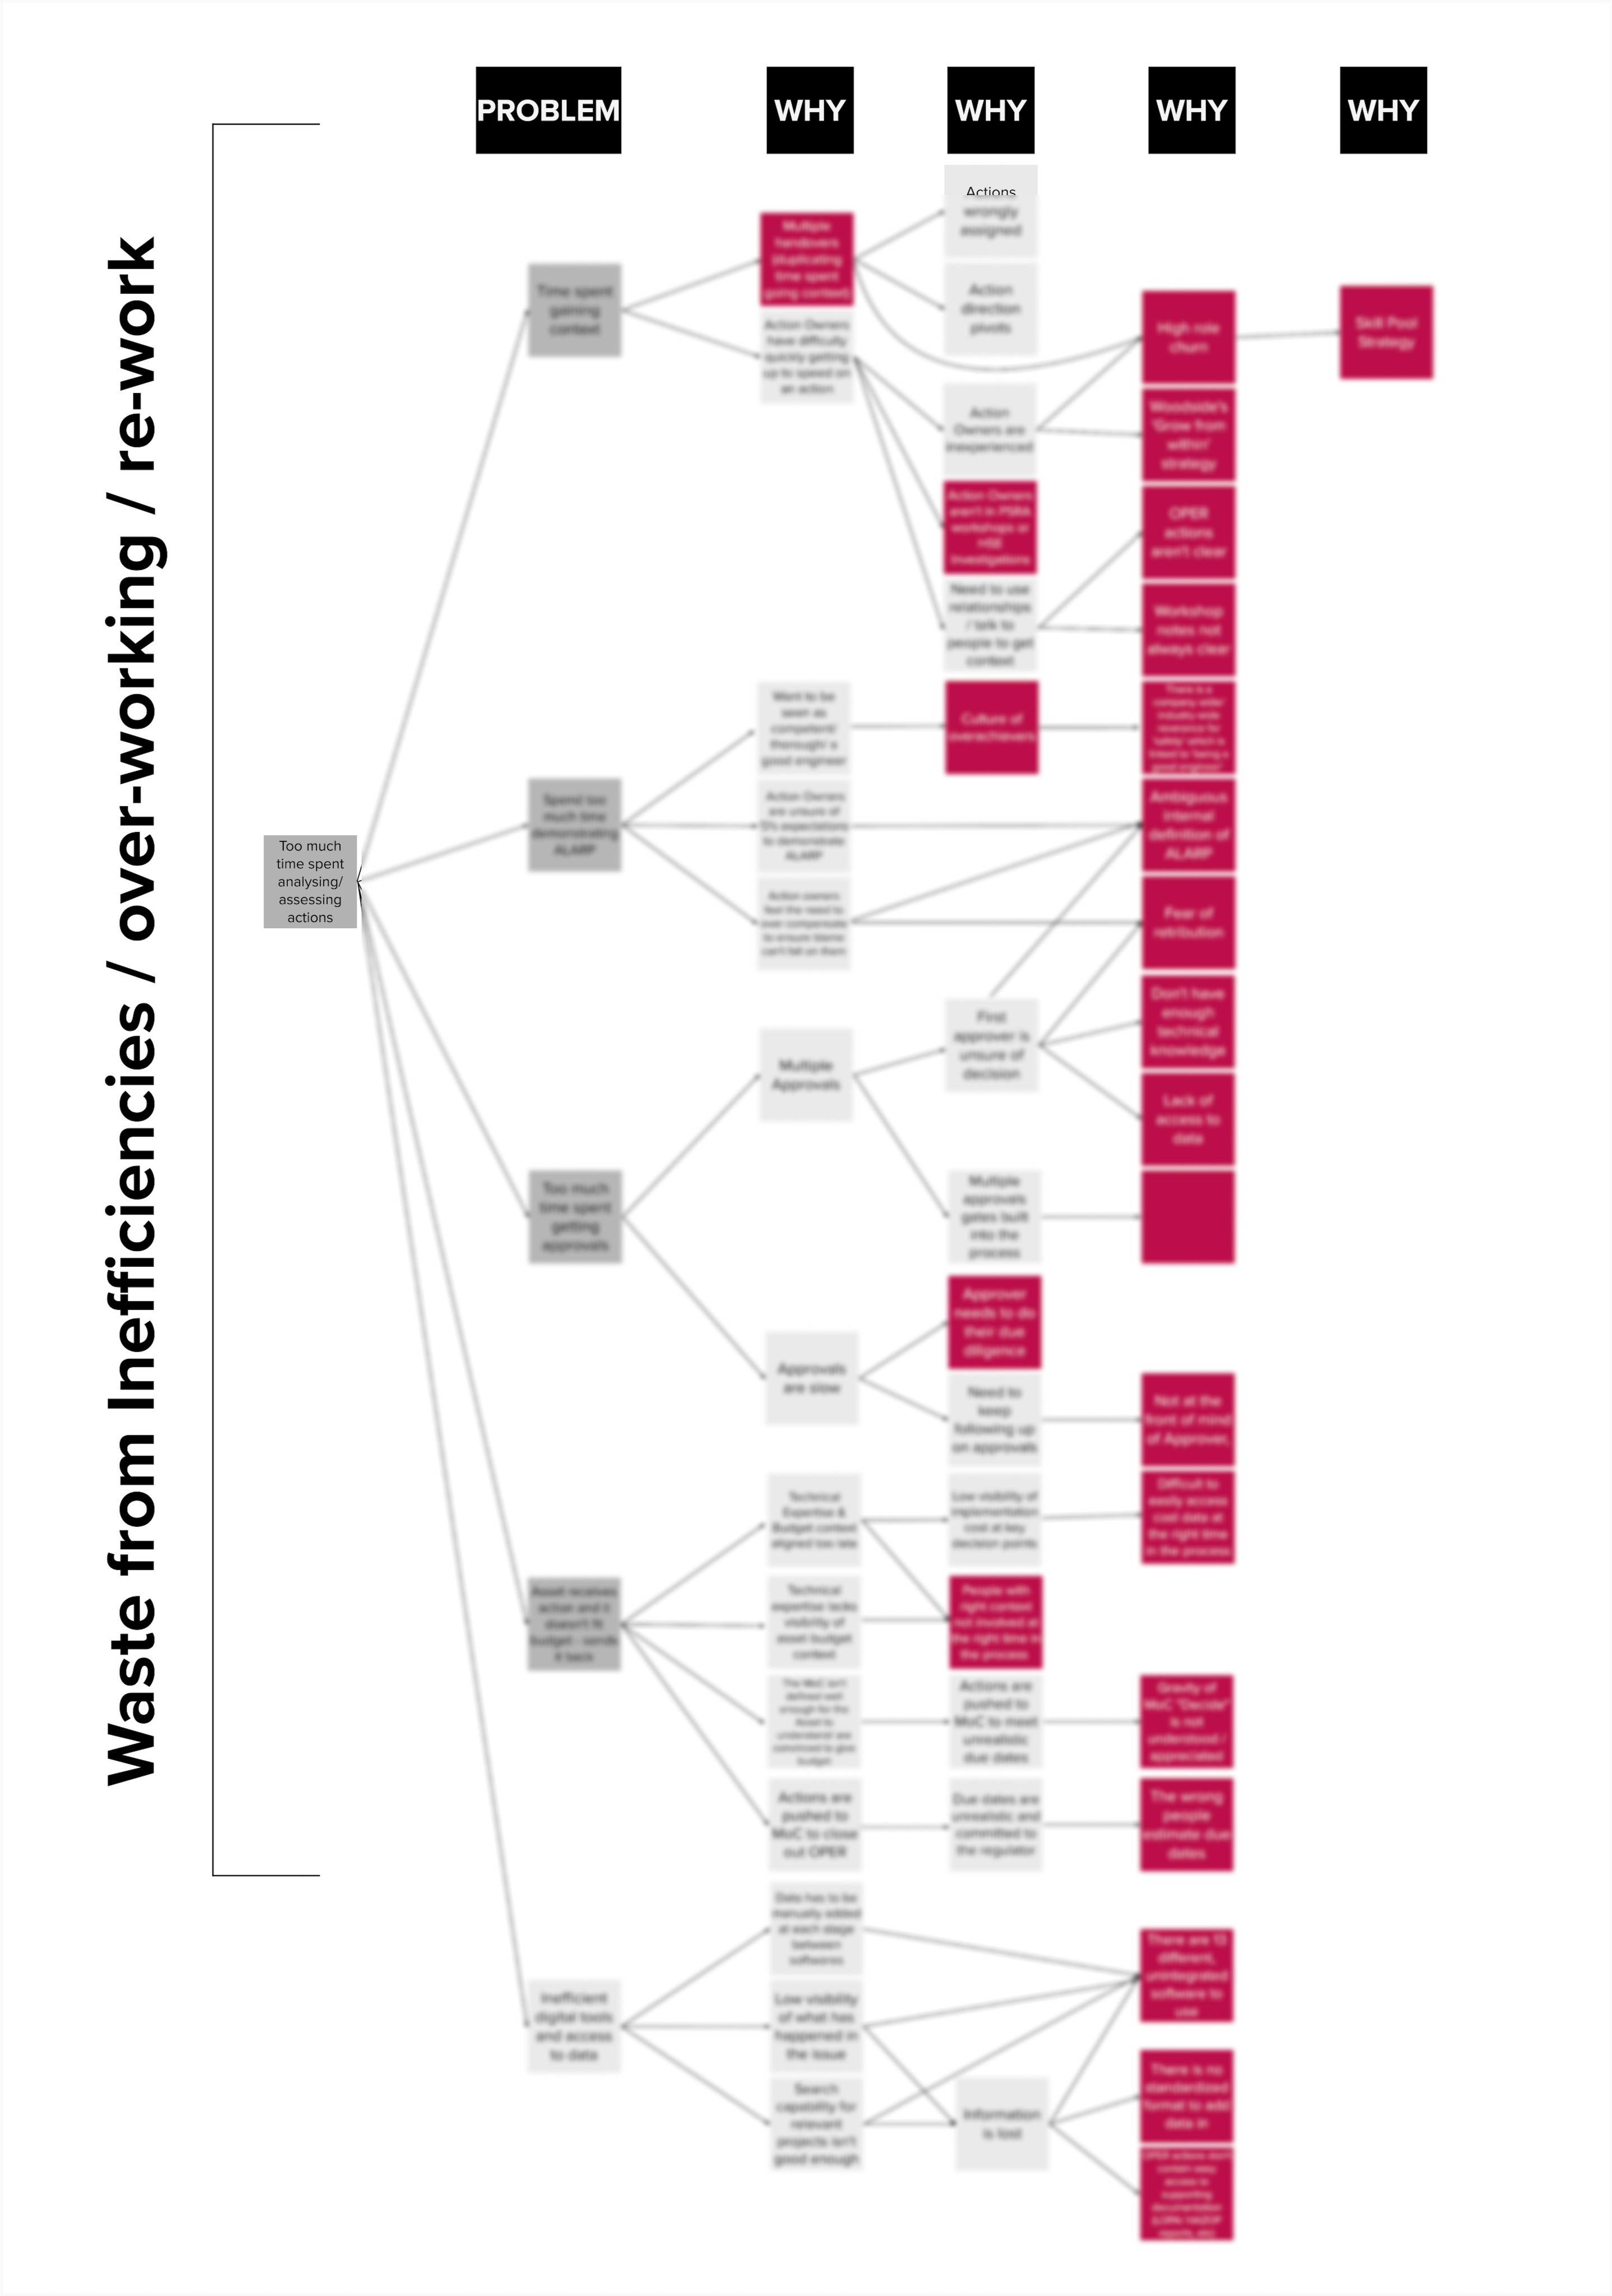
Root Cause Analysis
To really understand the root cause of the problems & pain points, I conducted a 5 why's analysis. These diagrams were split into the 2 identified improvement areas.
Since the problem space had a lot of cultural influences, this activity really helped us get to the bottom of why we were seeing certain behaviours & outcomes.
Root cause analysis
Design
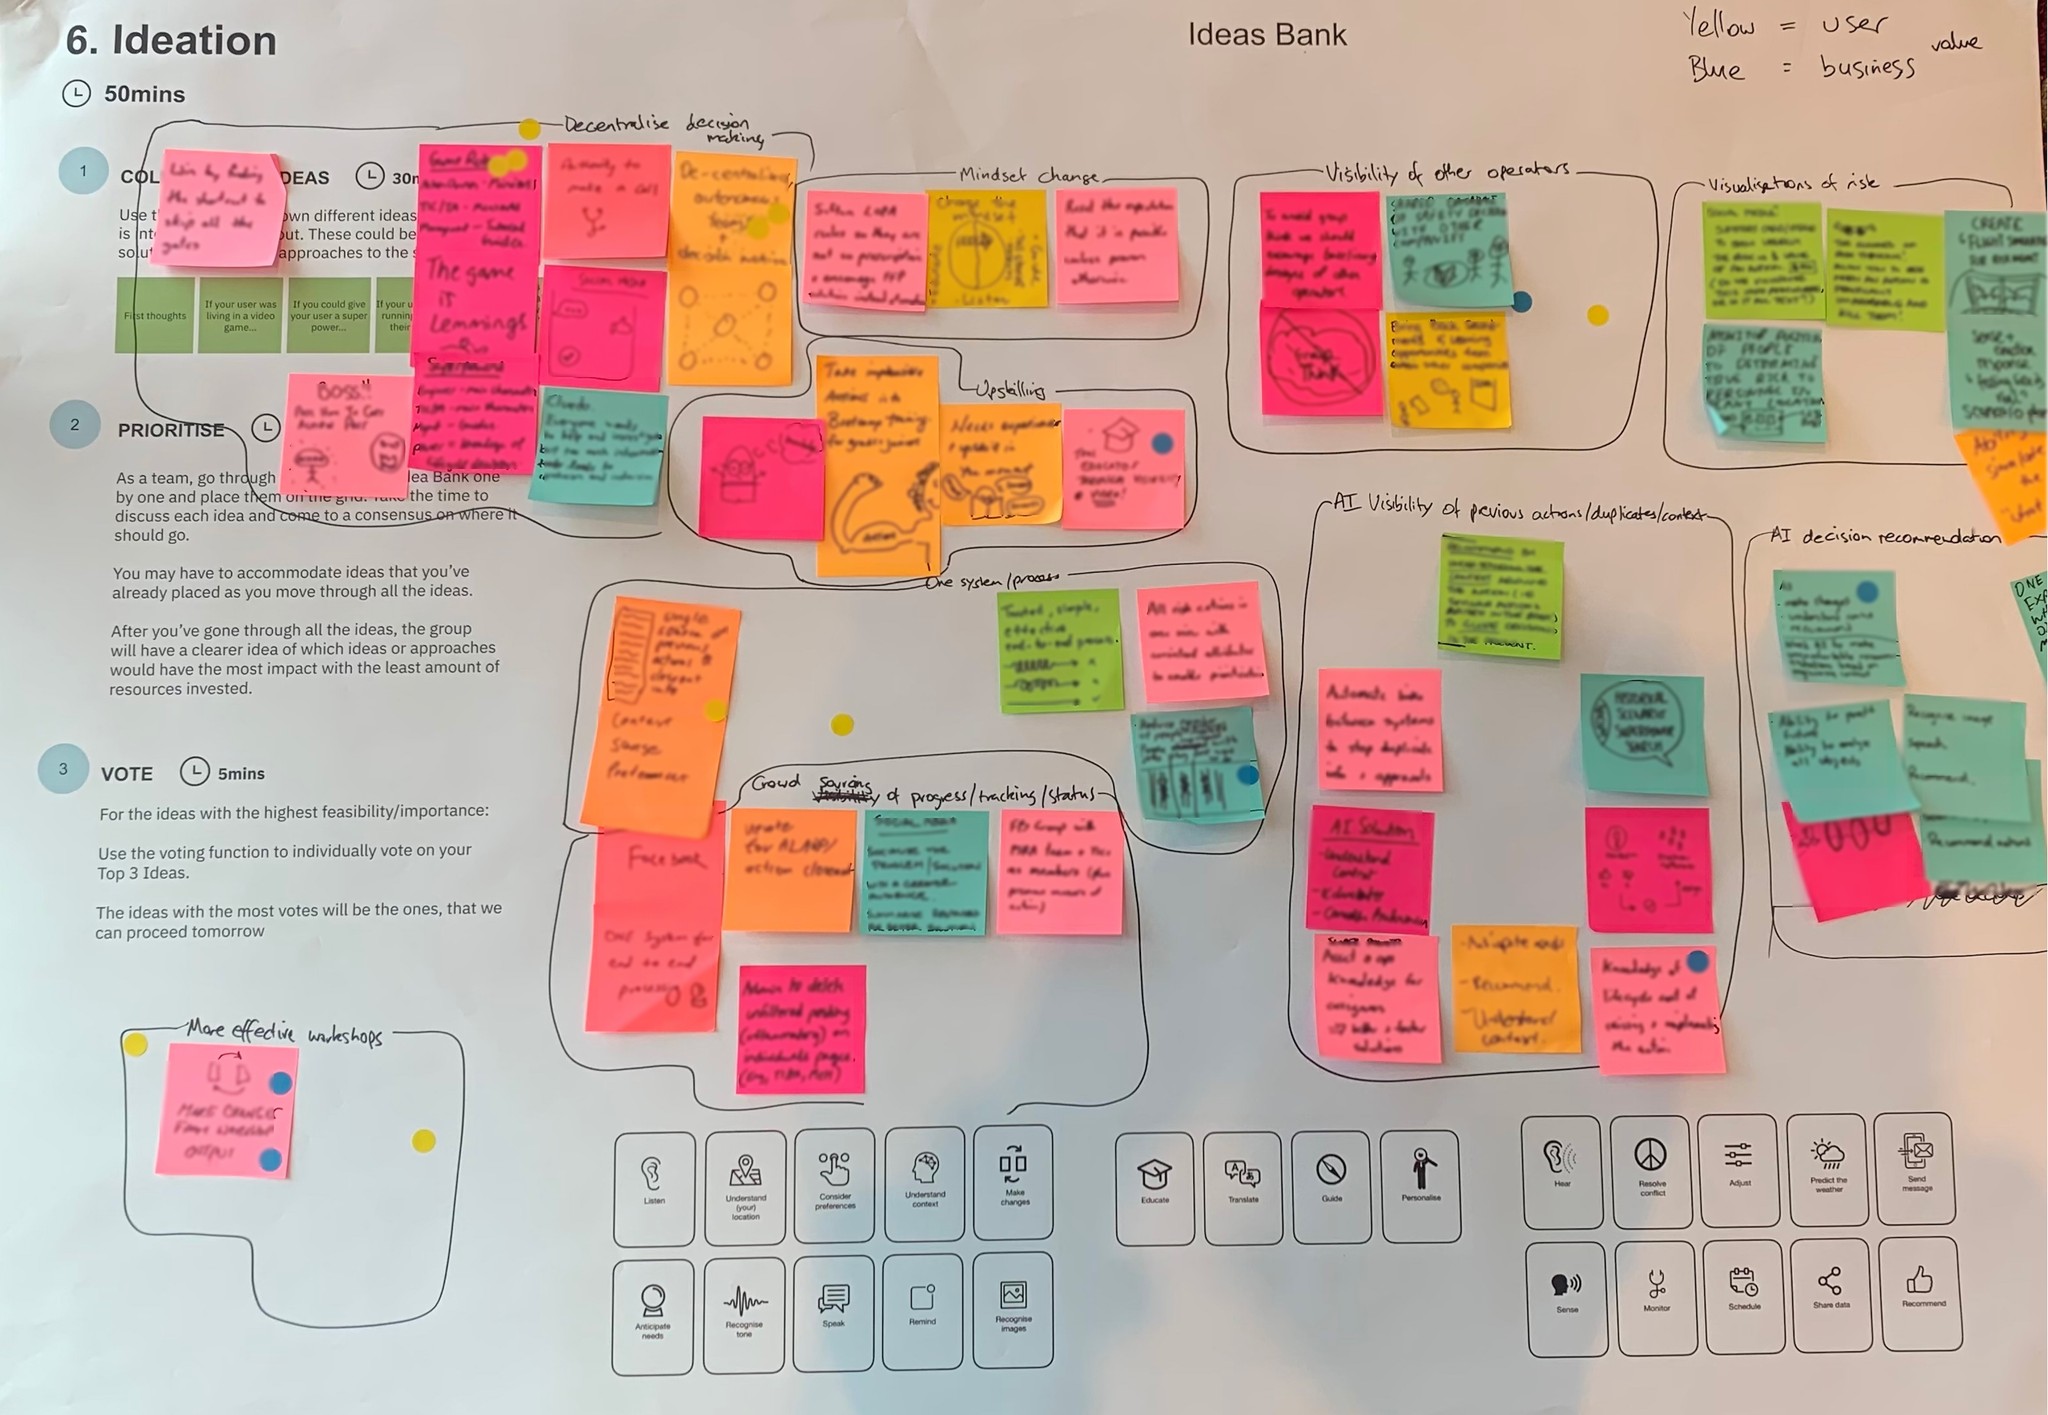
Solution Ideation
We used a variety of methods to gather solution ideas:
Ideation sessions with users & stakeholders
Current state analysis
Ideas raised in interviews
Internal team ideation sessions
Value analysis
Solution value / feasibility analysis
Ideation workshop
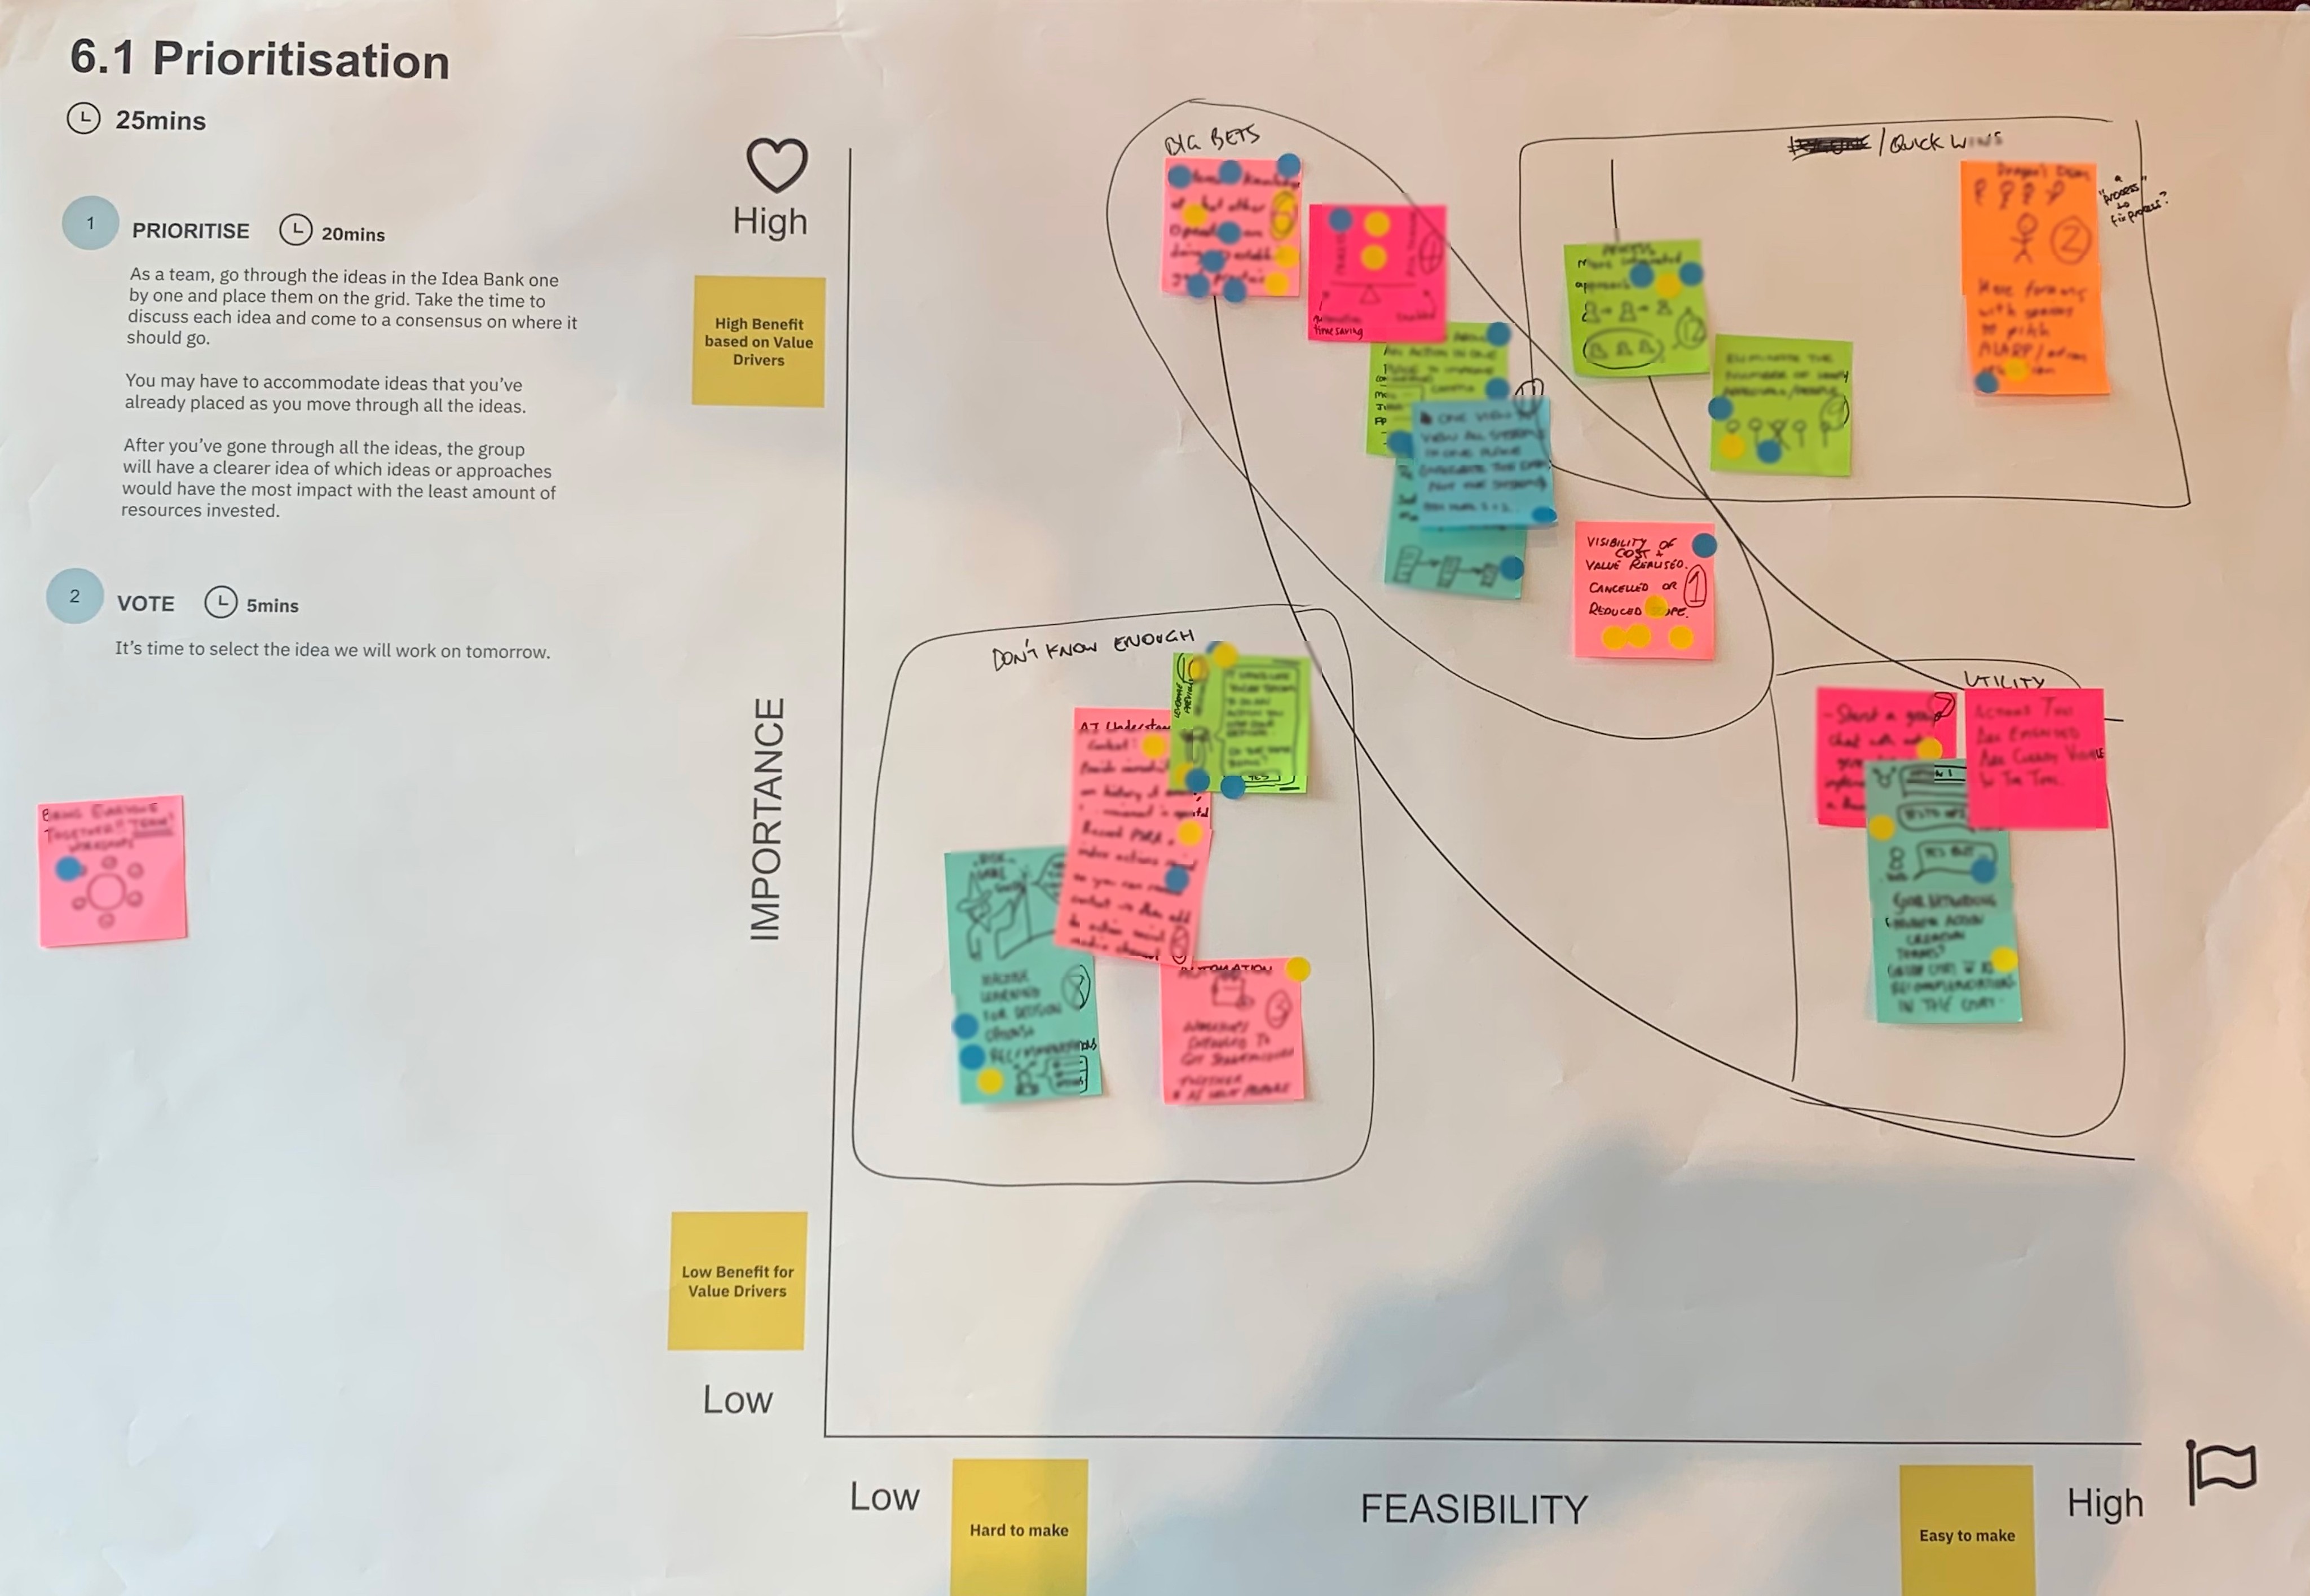
As a team, we then evaluated and prioritised each solutions based on desirability, viability & feasibility.
Idea Prioritisation
Not just a digital solution
Verken onze projectenportefeuille en zie de invloed van onze ontwerp- en merkbenaderingen in actie.
Verken onze projectenportefeuille en zie de invloed van onze ontwerp- en merkbenaderingen in actie.
Verken onze projectenportefeuille en zie de invloed van onze ontwerp- en merkbenaderingen in actie.
Verken onze projectenportefeuille en zie de invloed van onze ontwerp- en merkbenaderingen in actie.
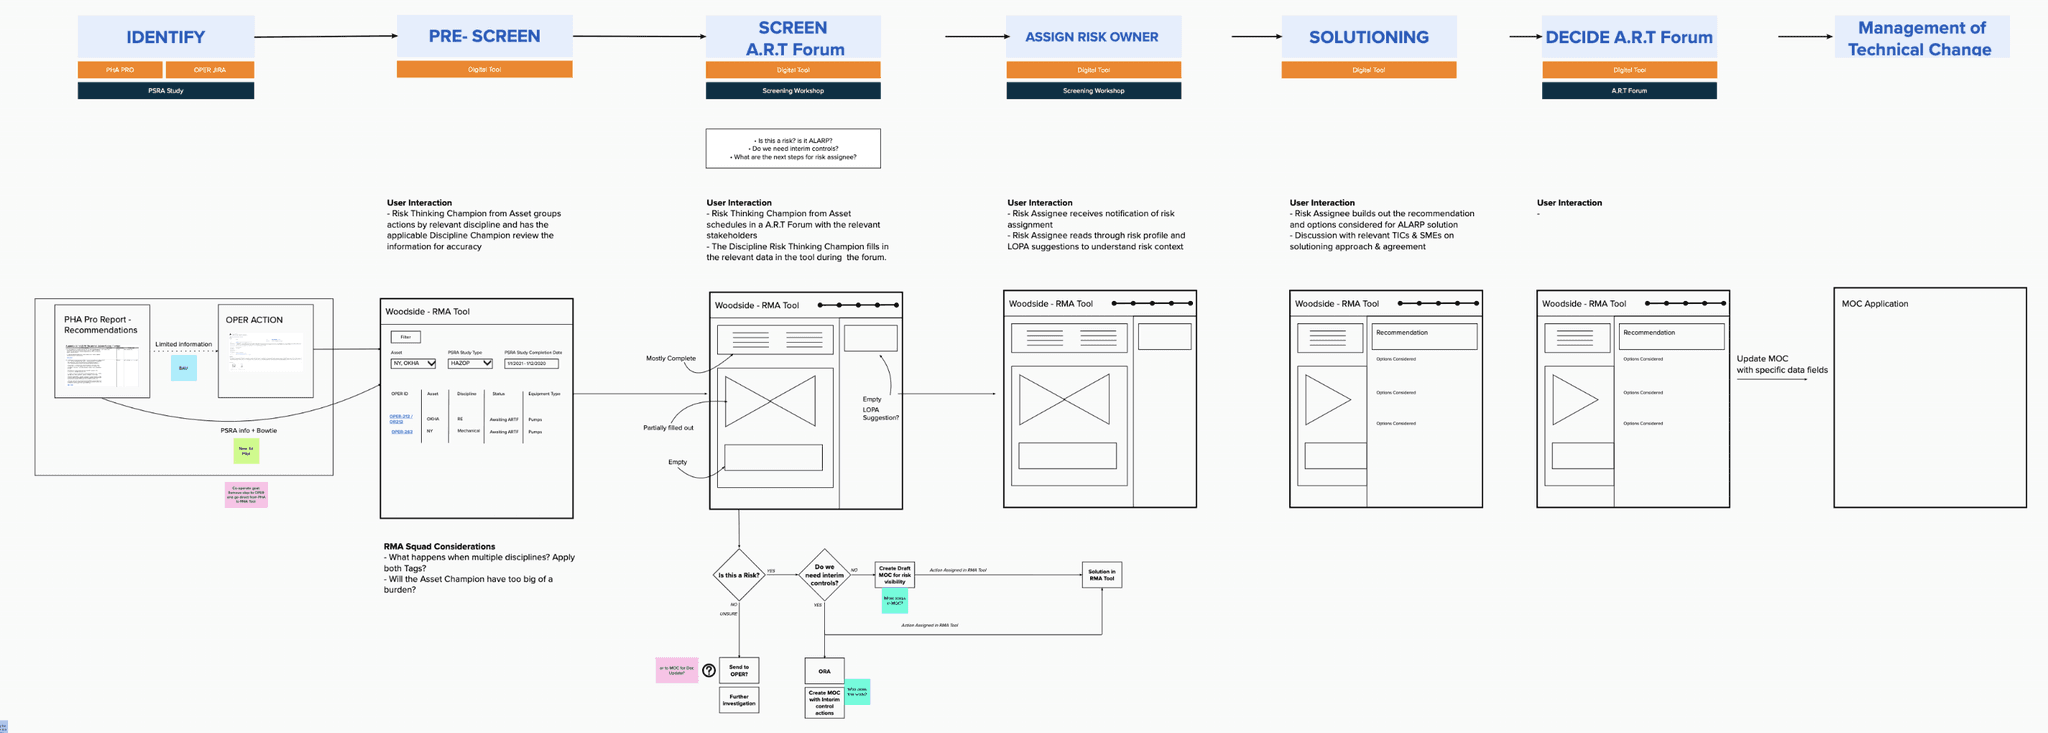
Future State User Journey
Future State Map
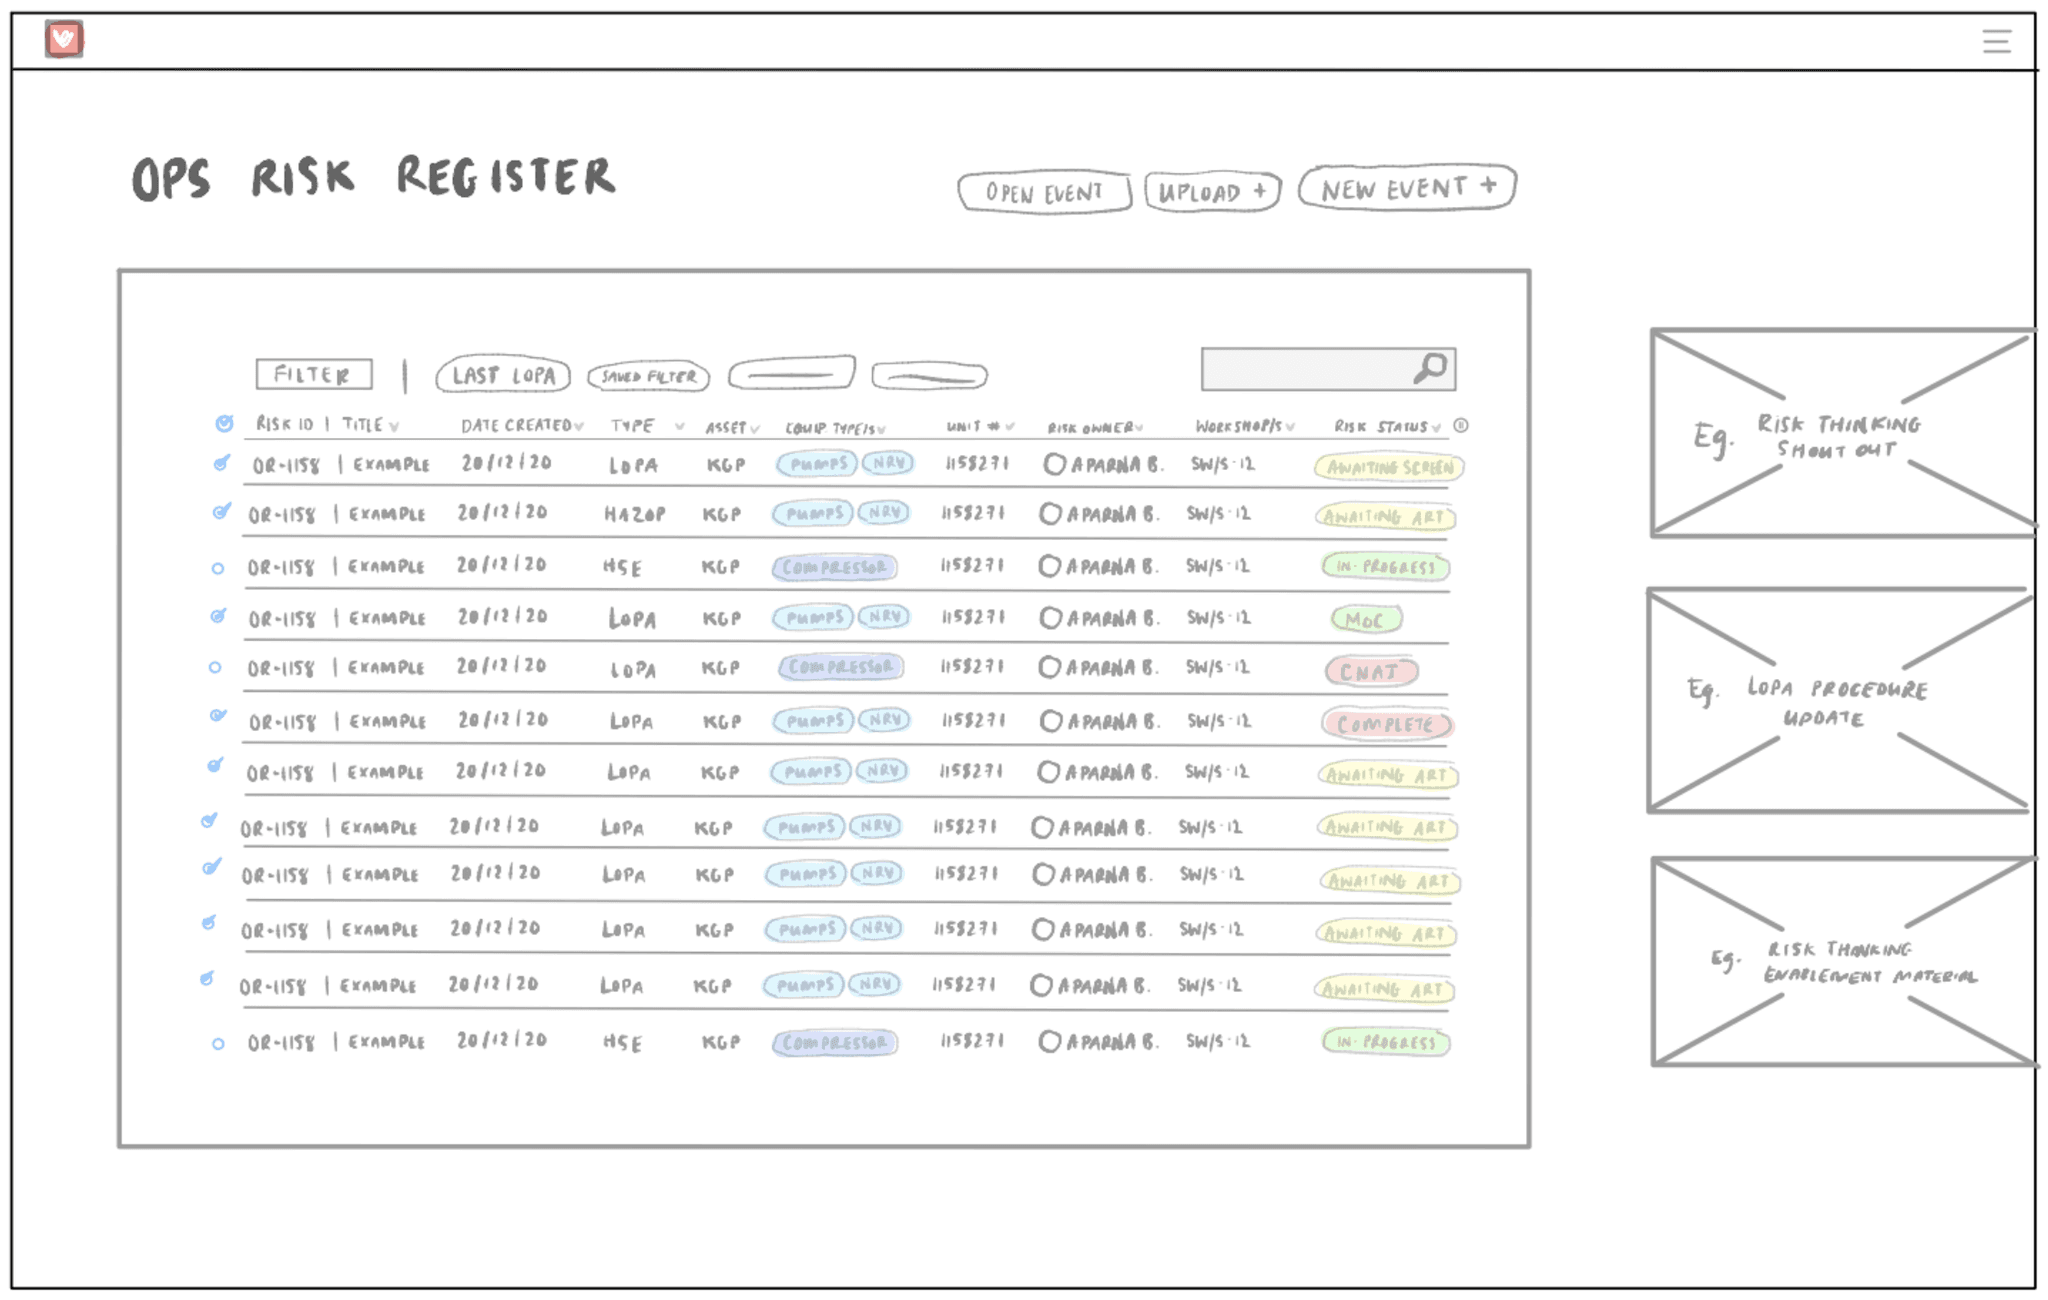
Low-Mid Fidelity
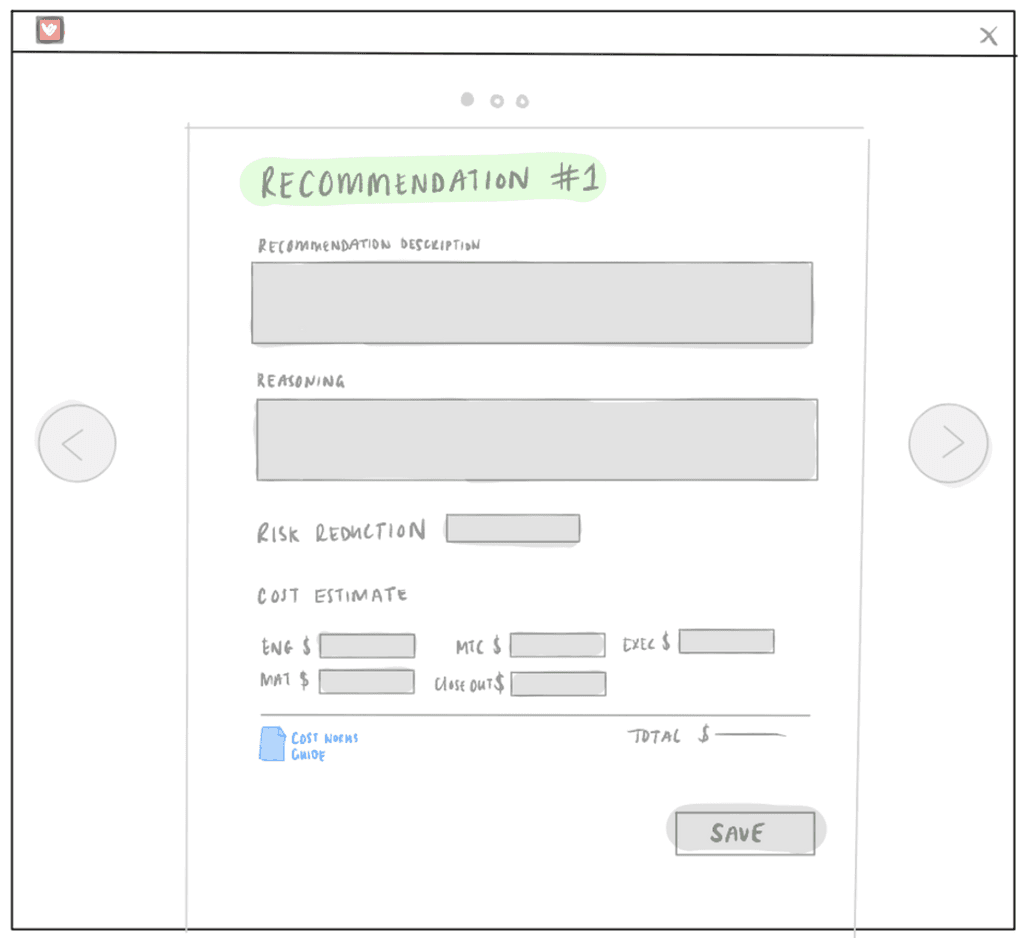
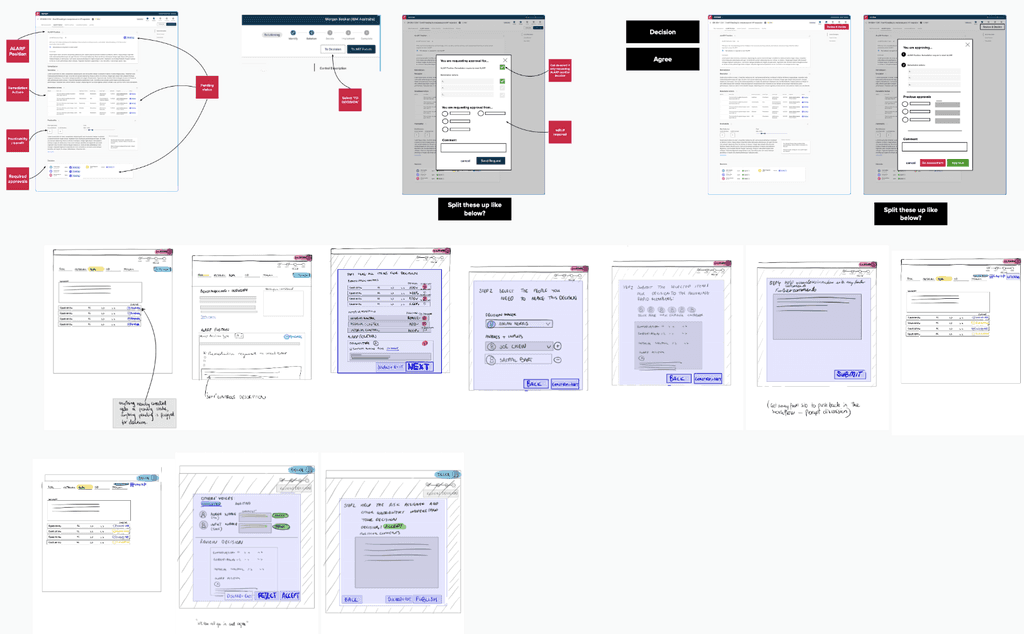
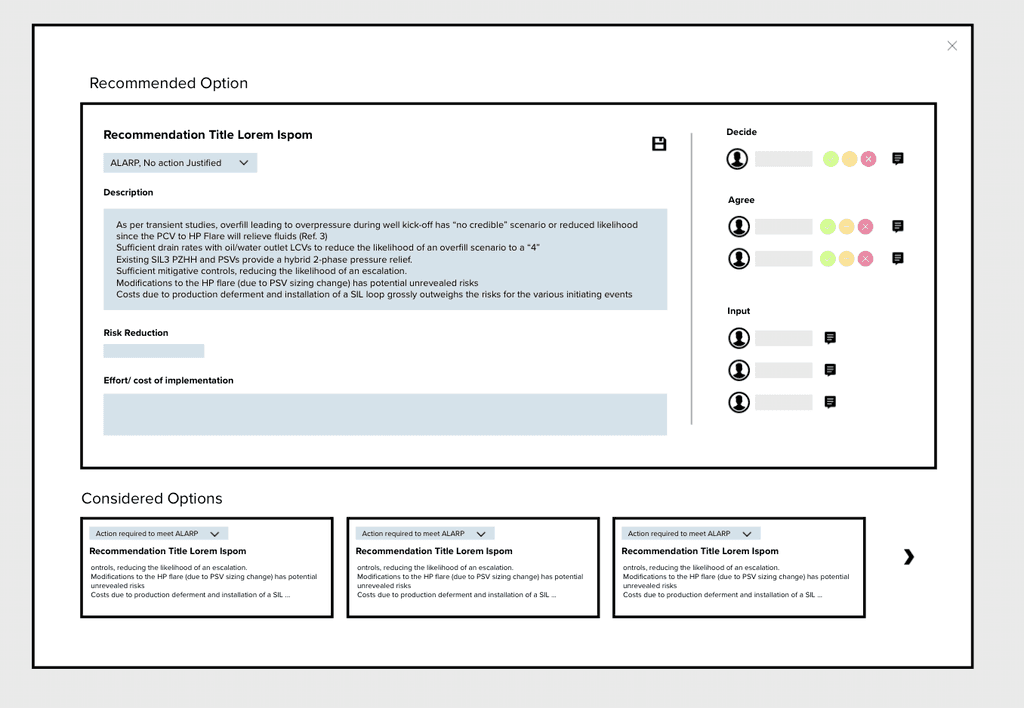
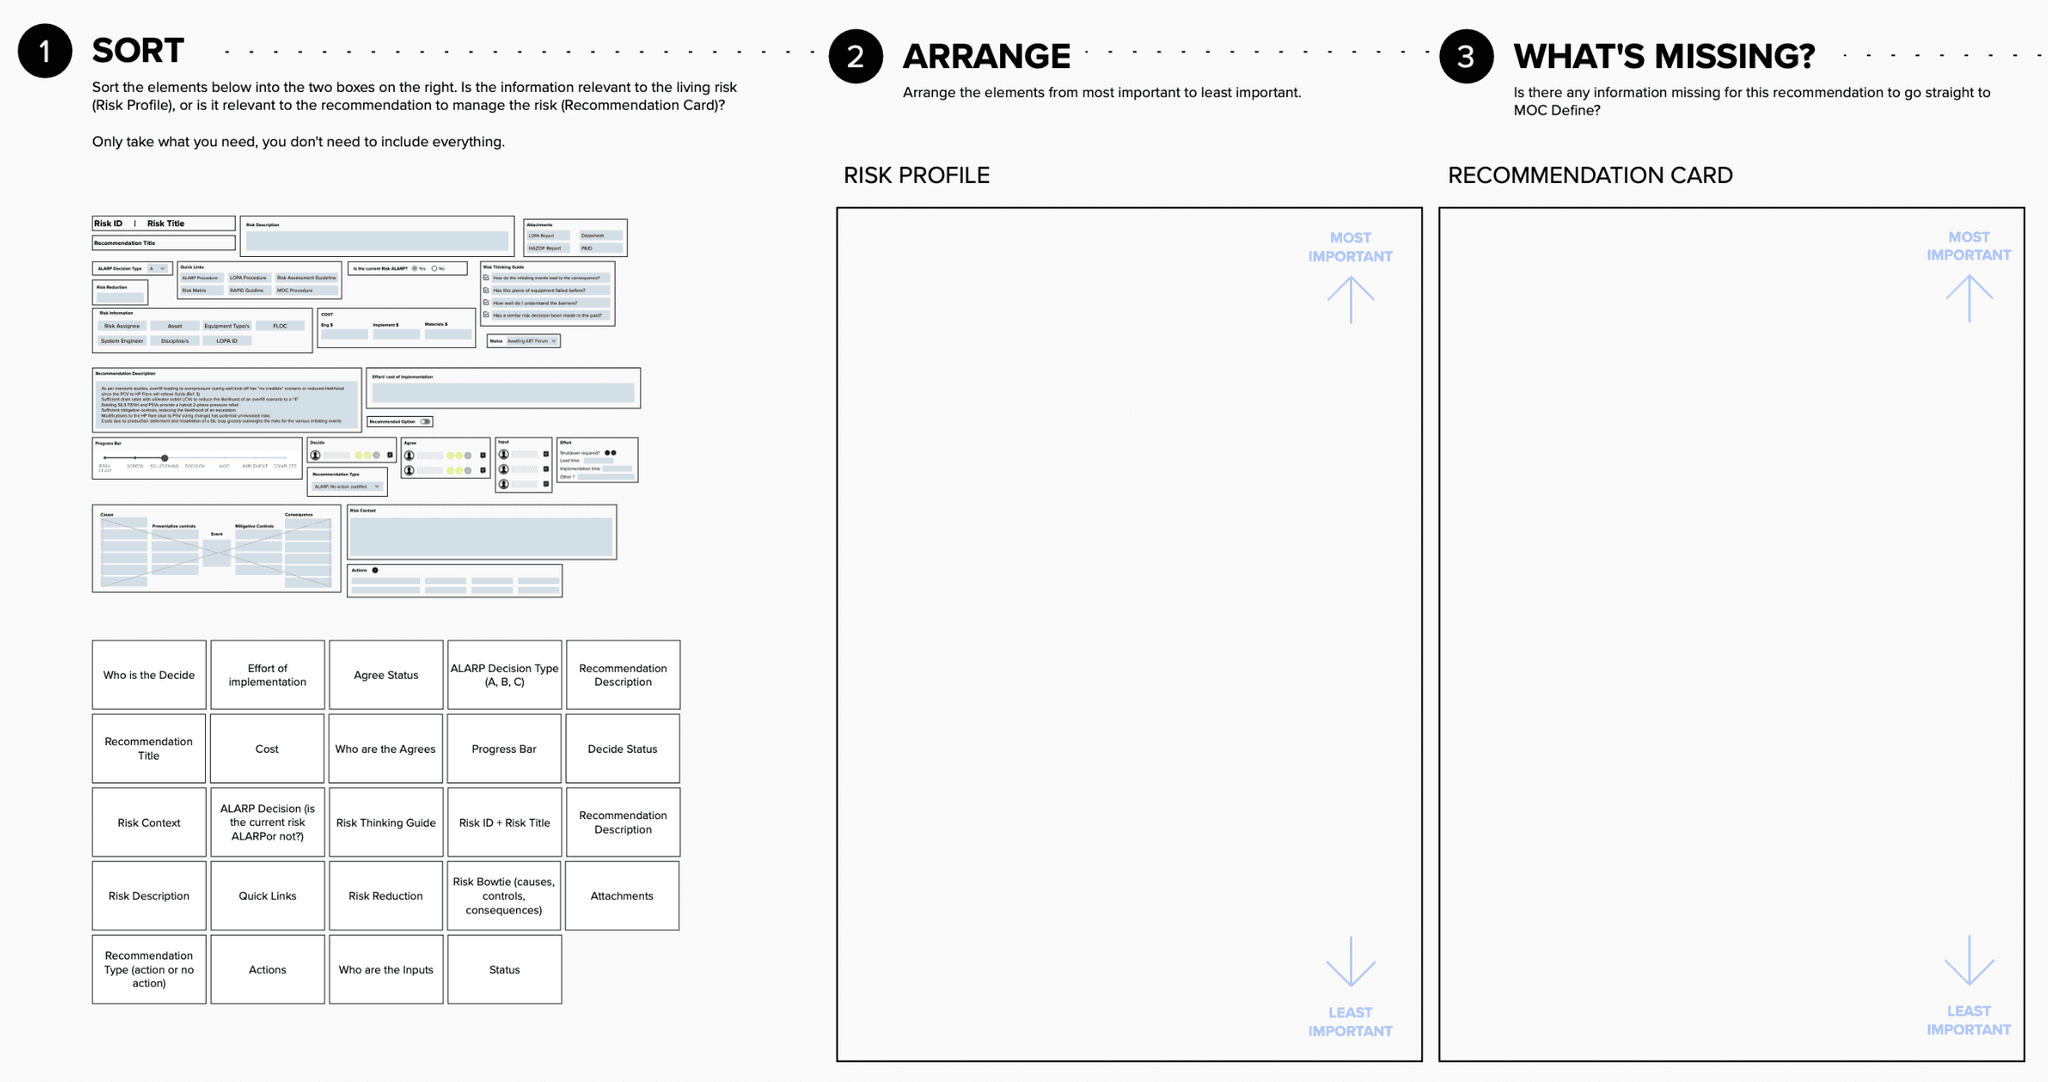
Initial user testing involved low-fi sketches & card sorting to validate user mental models to inform application workflows & information hierarchy.
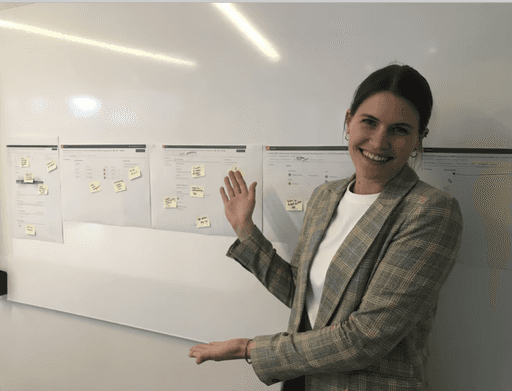
I had built strong relationships with my users, so often I would send them a Mural link with a bunch of screen shots and get them to add feedback. This allowed for an asynchronous working style, which suited the users that were time poor.
"This is world leading in the industry as far as I know"
- Ops Manager
Wireframe sketches
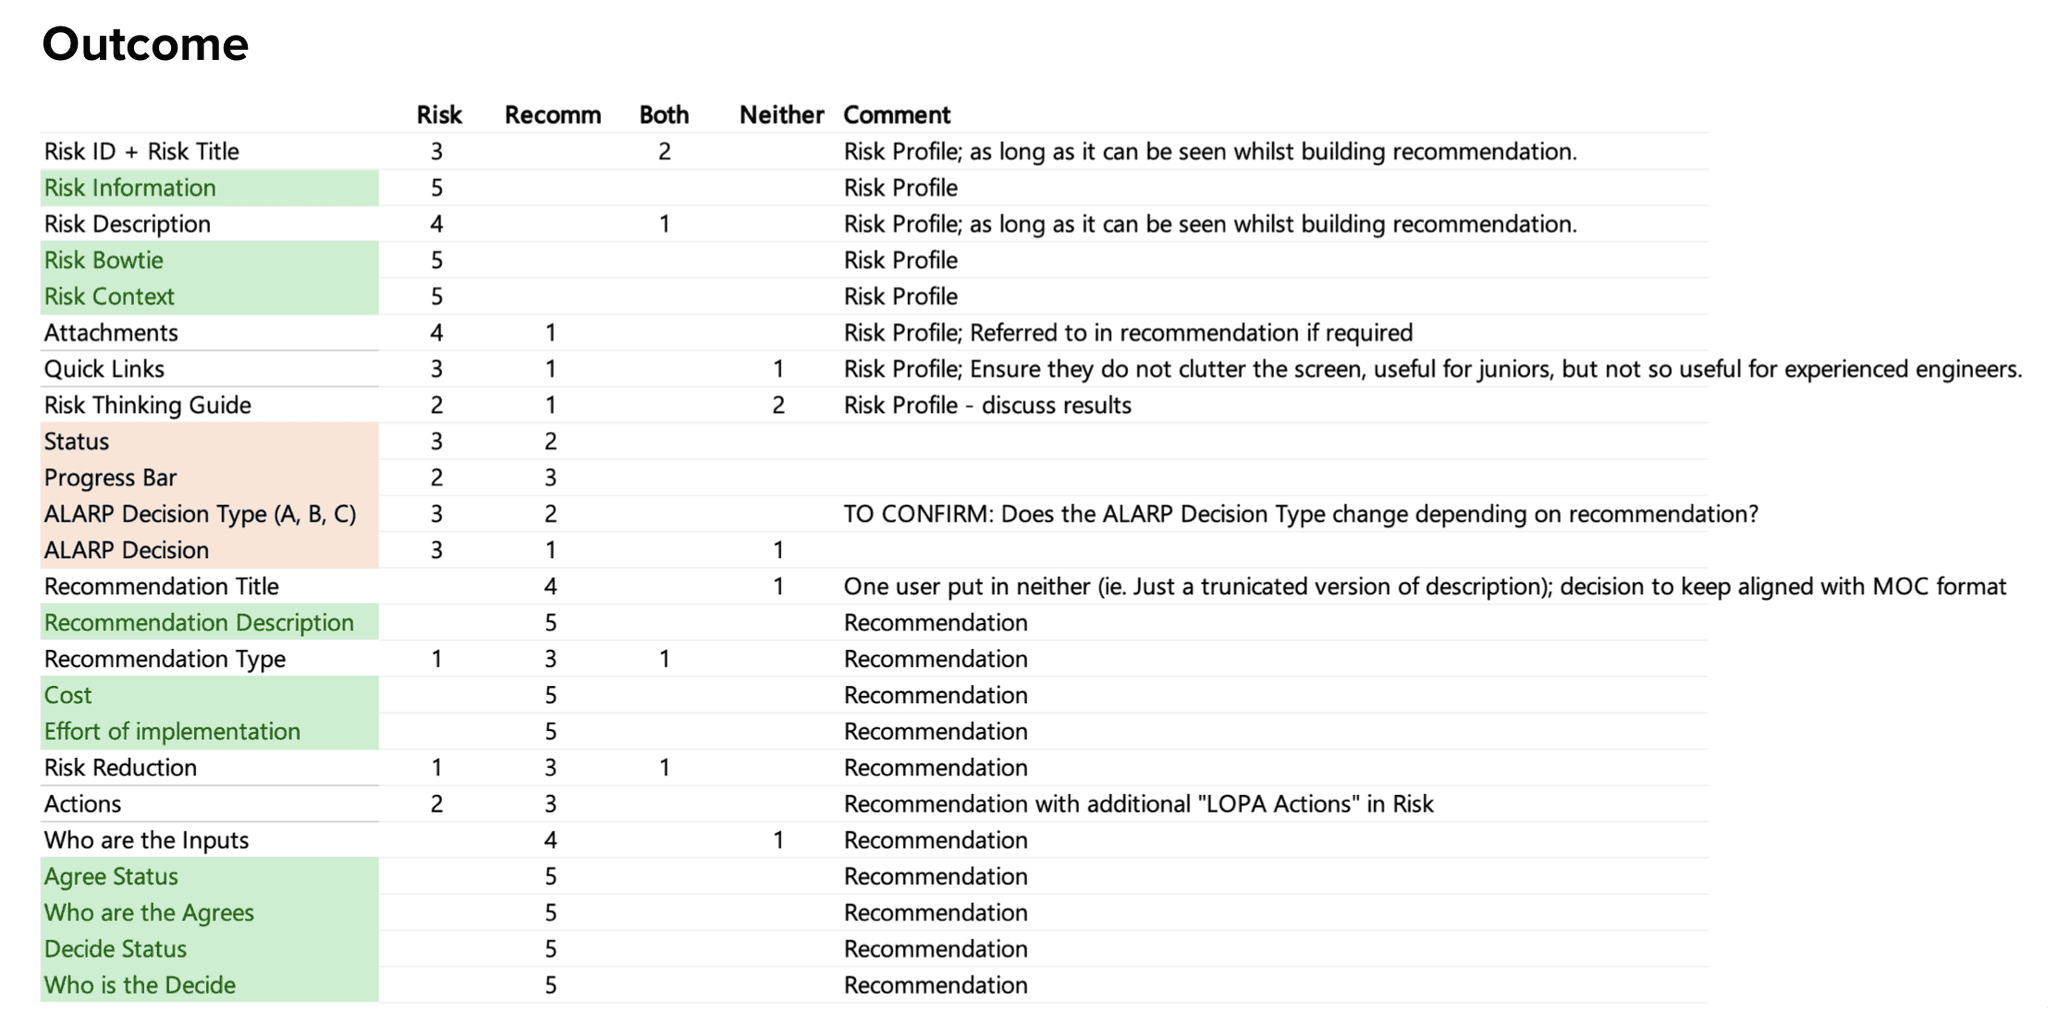
Mid-fi UI review and card-sorting activity, results of card sorting
Information Hierarchy
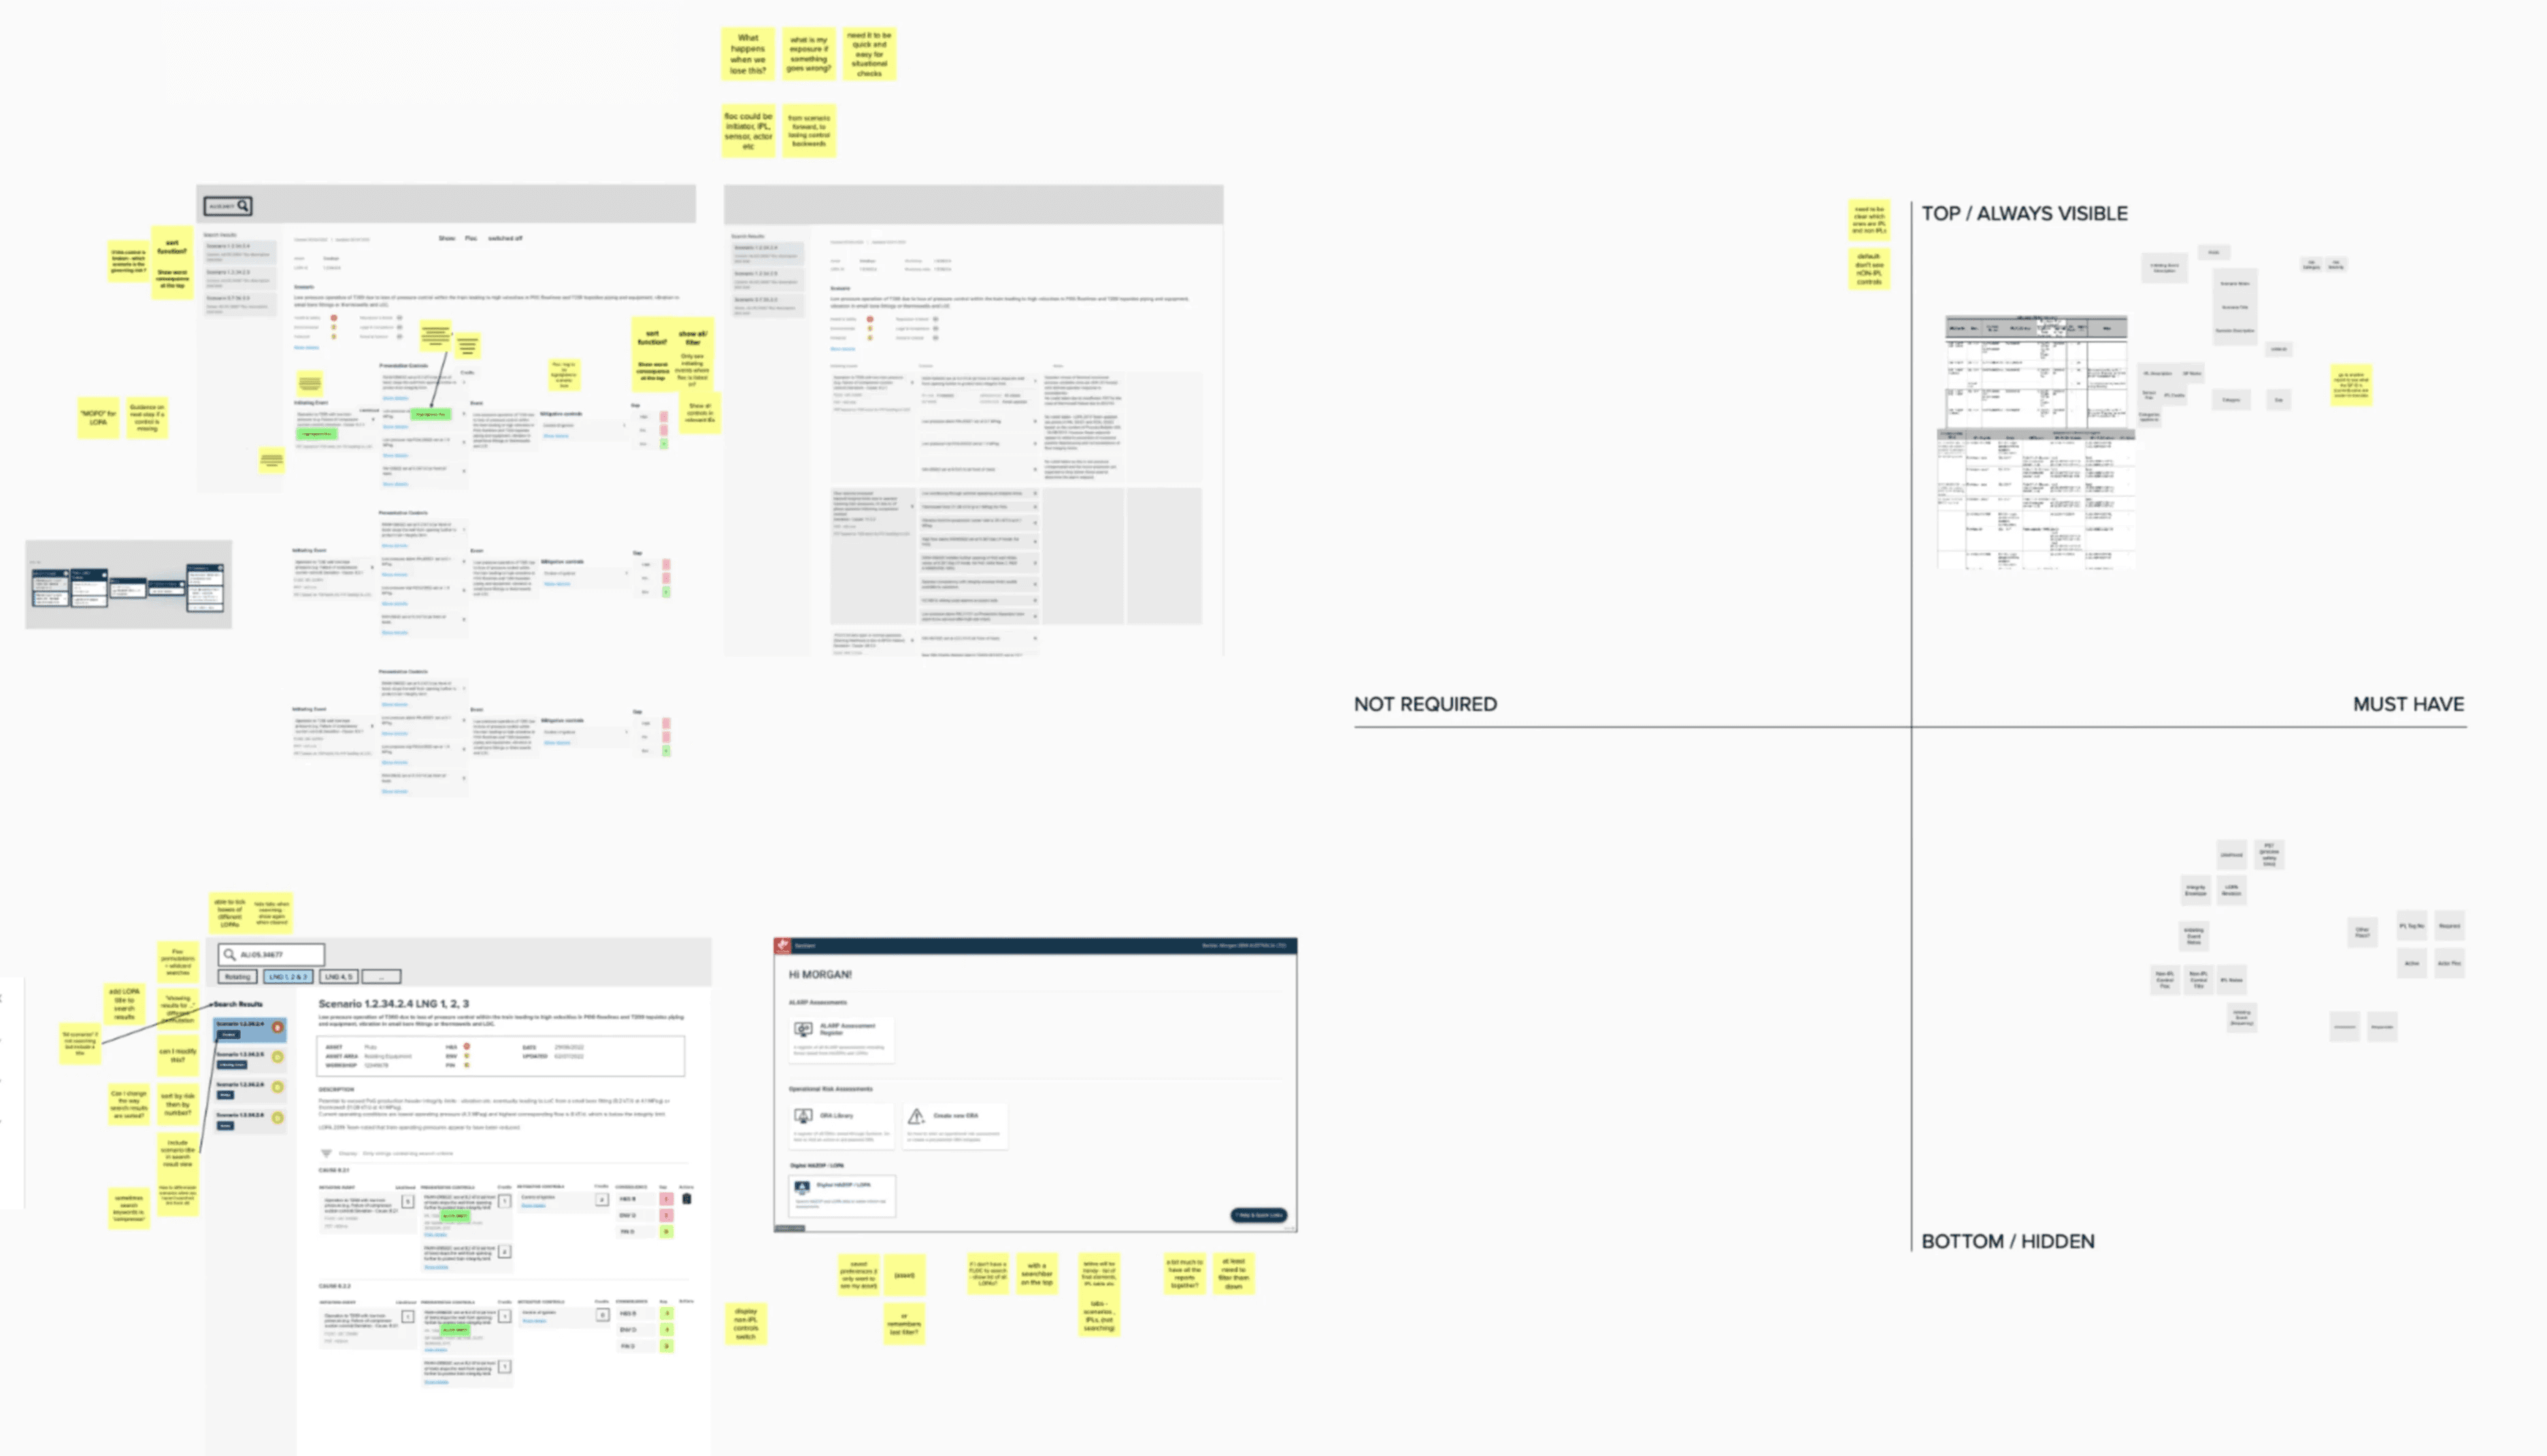
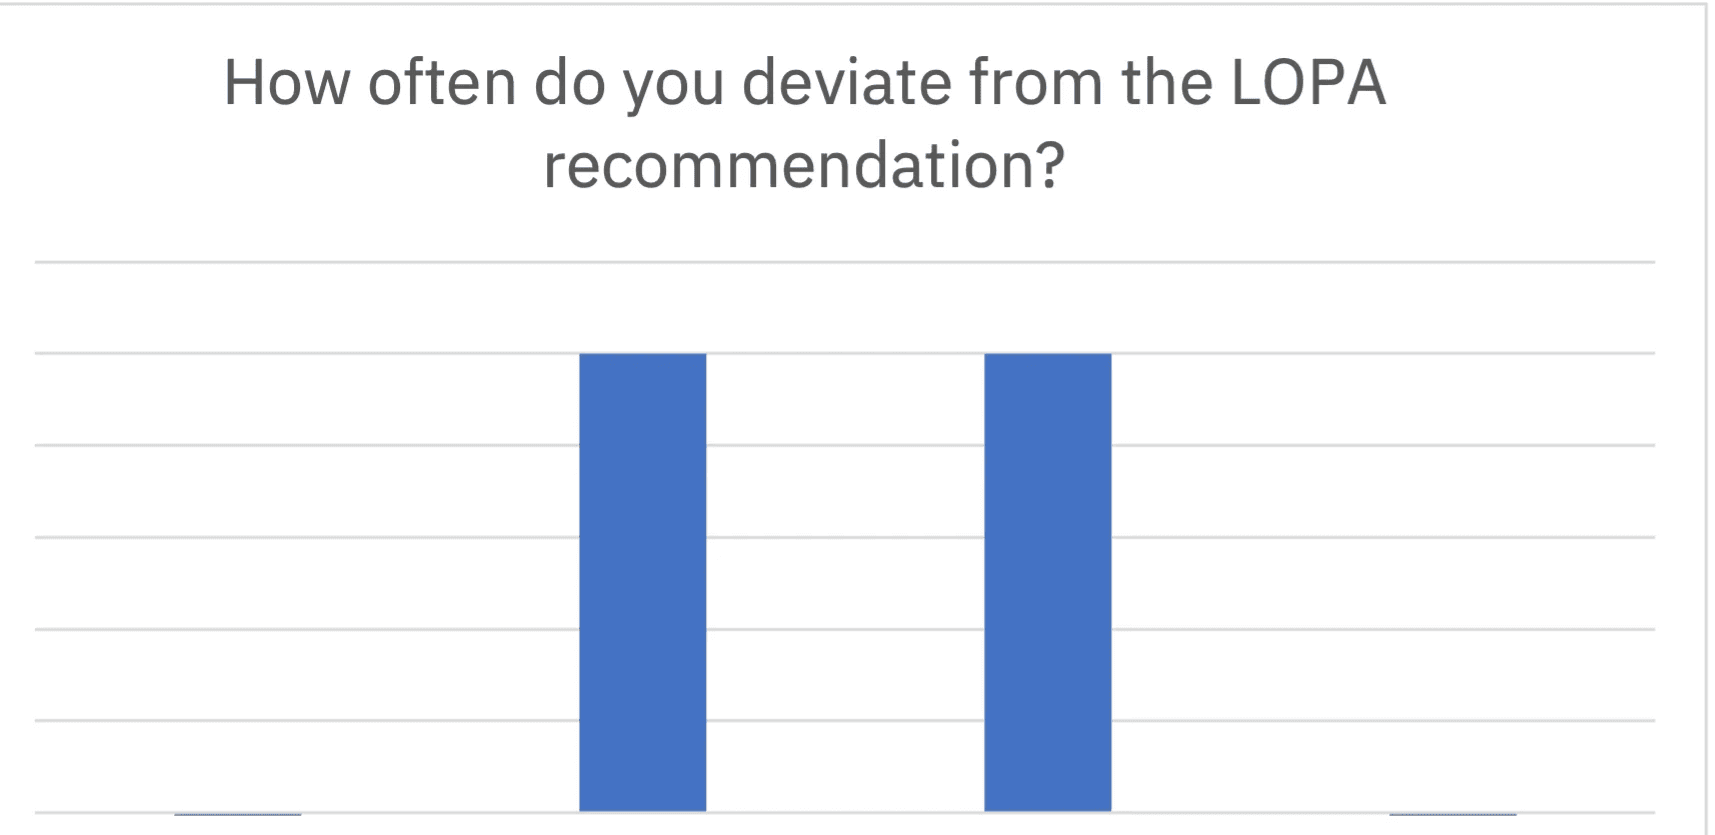
To gain a deeper understanding of how to display information, I conducted a card sorting activity along with A/B testing & a survey.
Card sorting Exercise
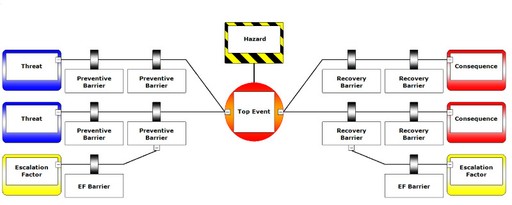
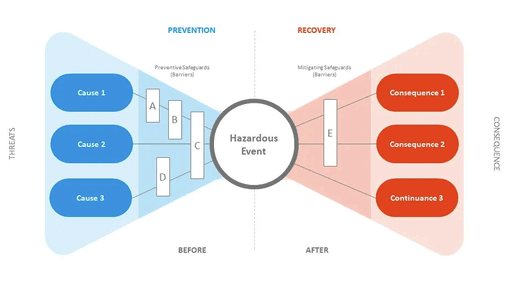
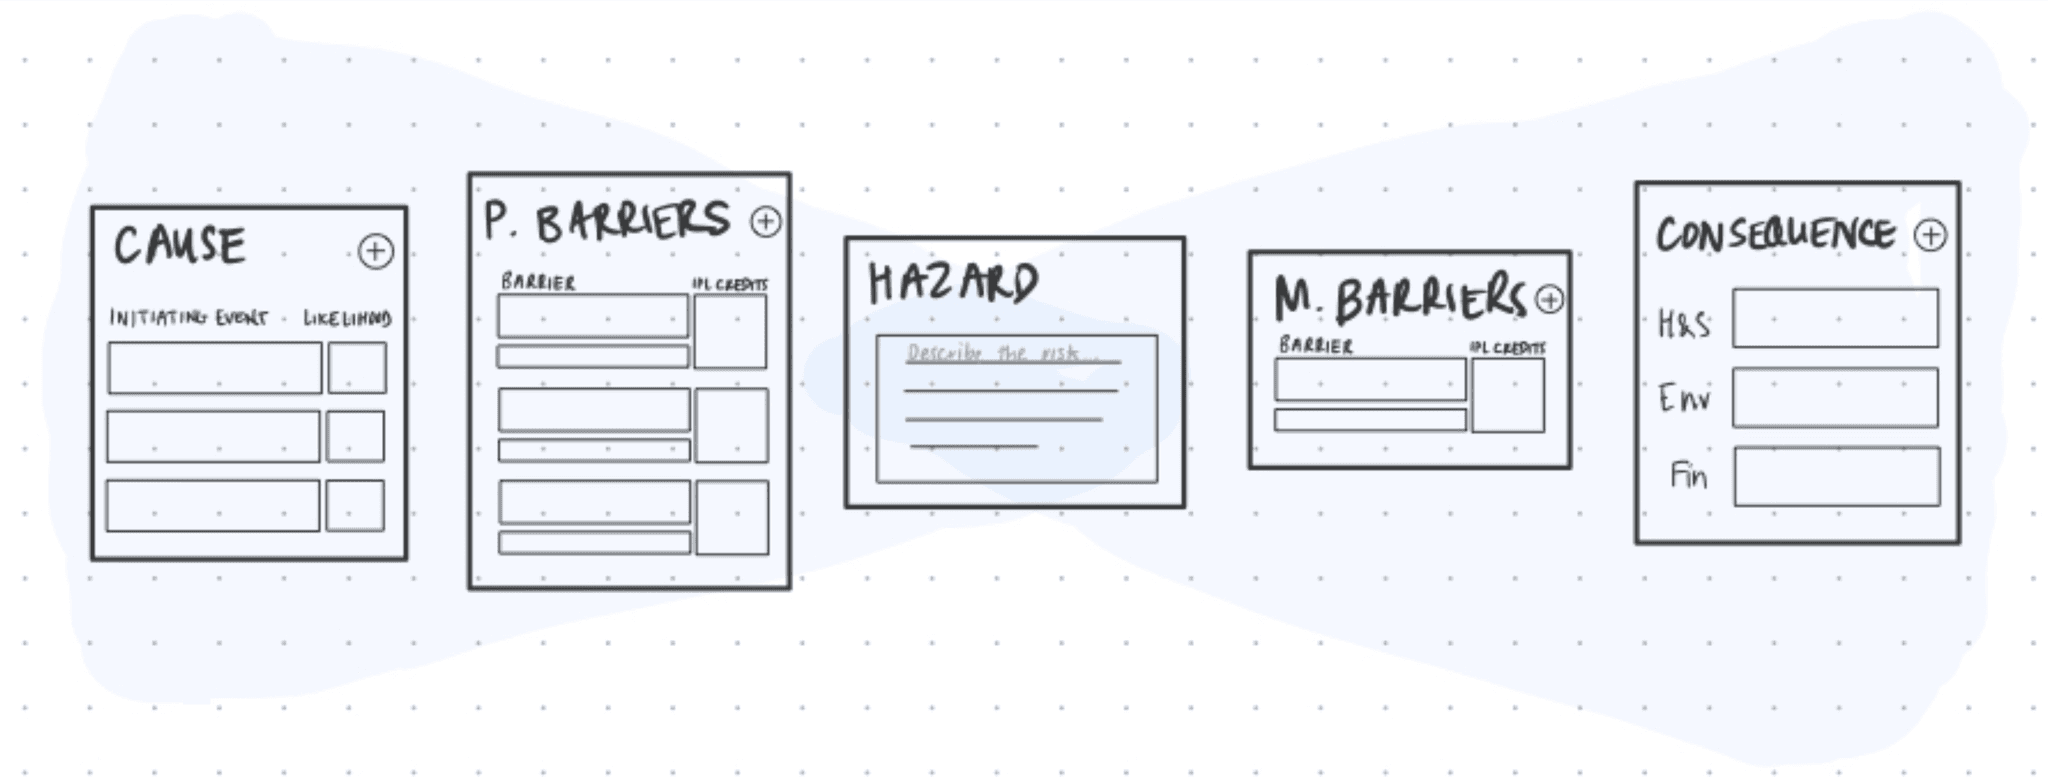
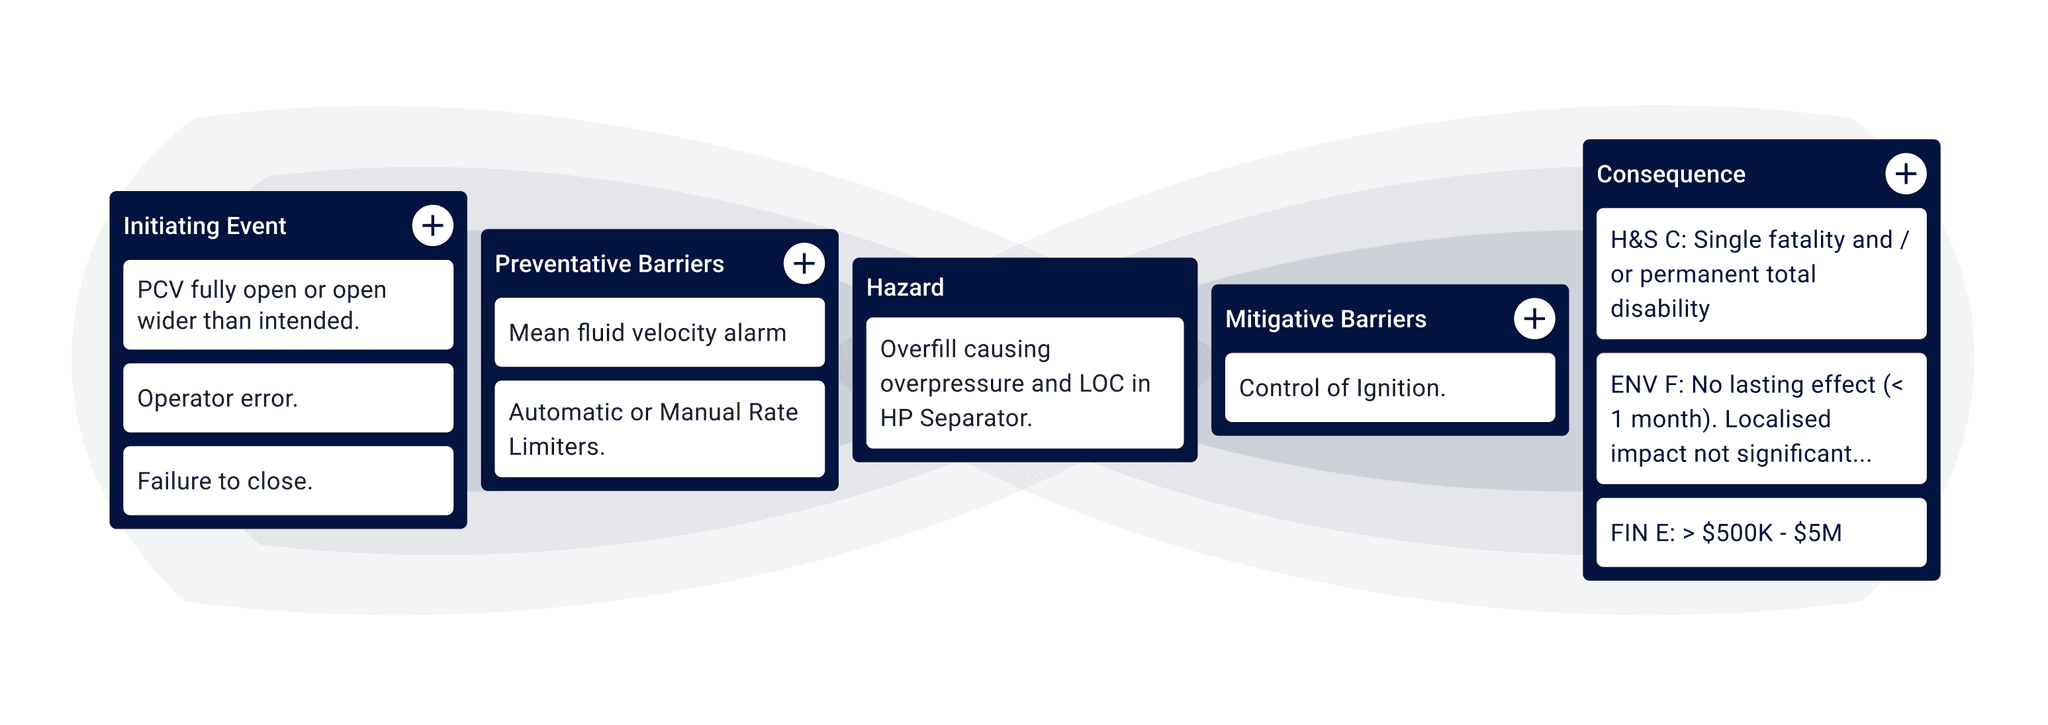
Re-imagining the risk bow-tie
The bow-tie was designed as a logical & consistent way to represent a risk.
This feature was highly valued by junior engineers, as it gave them a clear & methodical way to document the controls.
"This makes more sense than the way it was taught to us."
- Graduate Process Engineer
Senior engineers took a little more convincing.
Each of them had slightly different ways that they were used to documenting risk.
We decided to implement an "MVP" version of the bow-tie first, to give us the opportunity to test it, but not spend too much development effort.
It got a lot of push back at first but, in the end, the bow-tie became loved by many & it was a feature that would be sticking around.
Bow-tie inspiration
Sketches
Final Design
Delivery
MVP
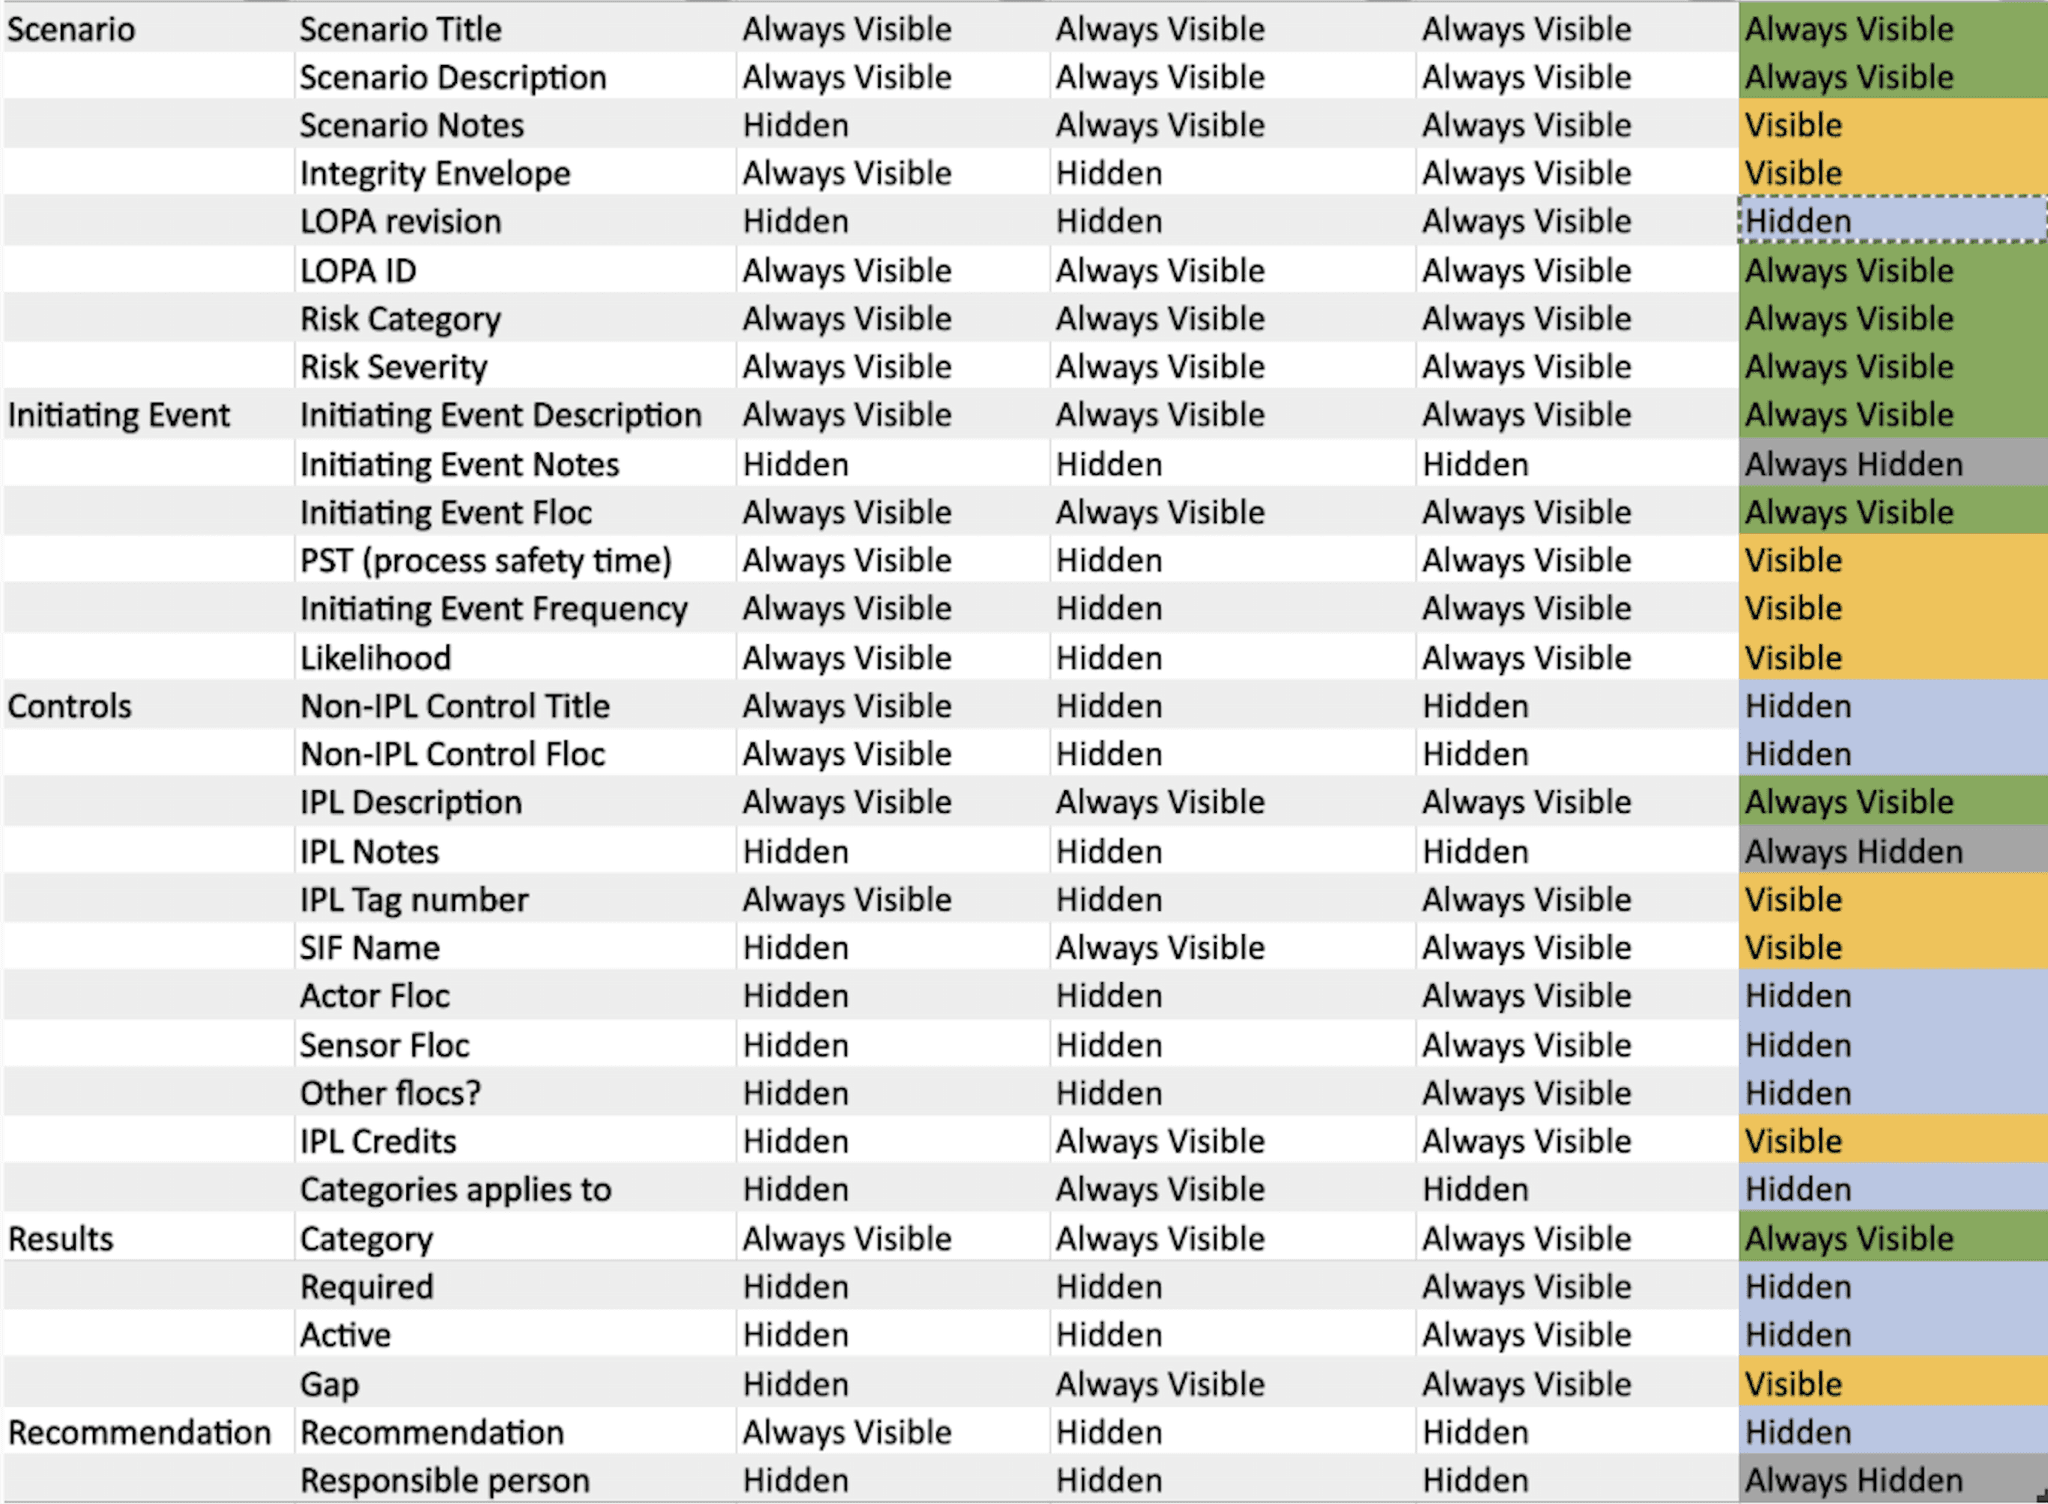
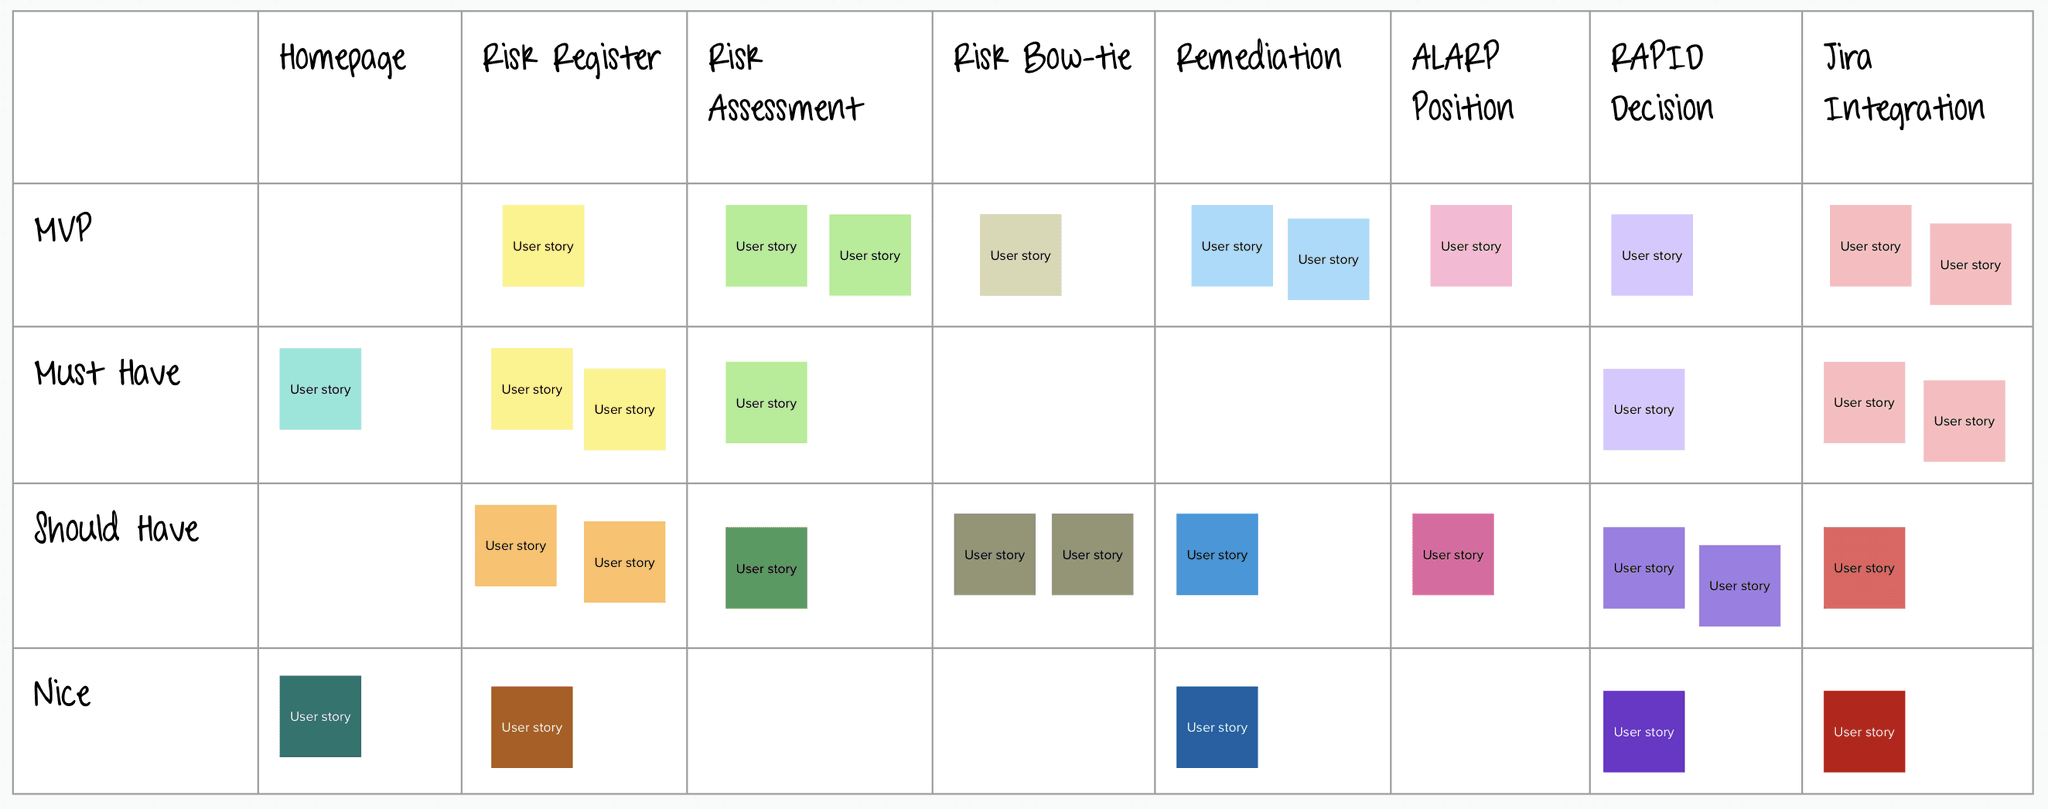
Once we had a solid understanding of the solution, I mapped out all the features in a Mural board. After discussing priorities with my team based on our research, I validated them with key users.
This artefact allowed us to ruthlessly hone in on the essentials for our MVP release, with the goal of getting something into users’ hands as quickly as possible.
Story Mapping template
Wizard of Oz Experiment
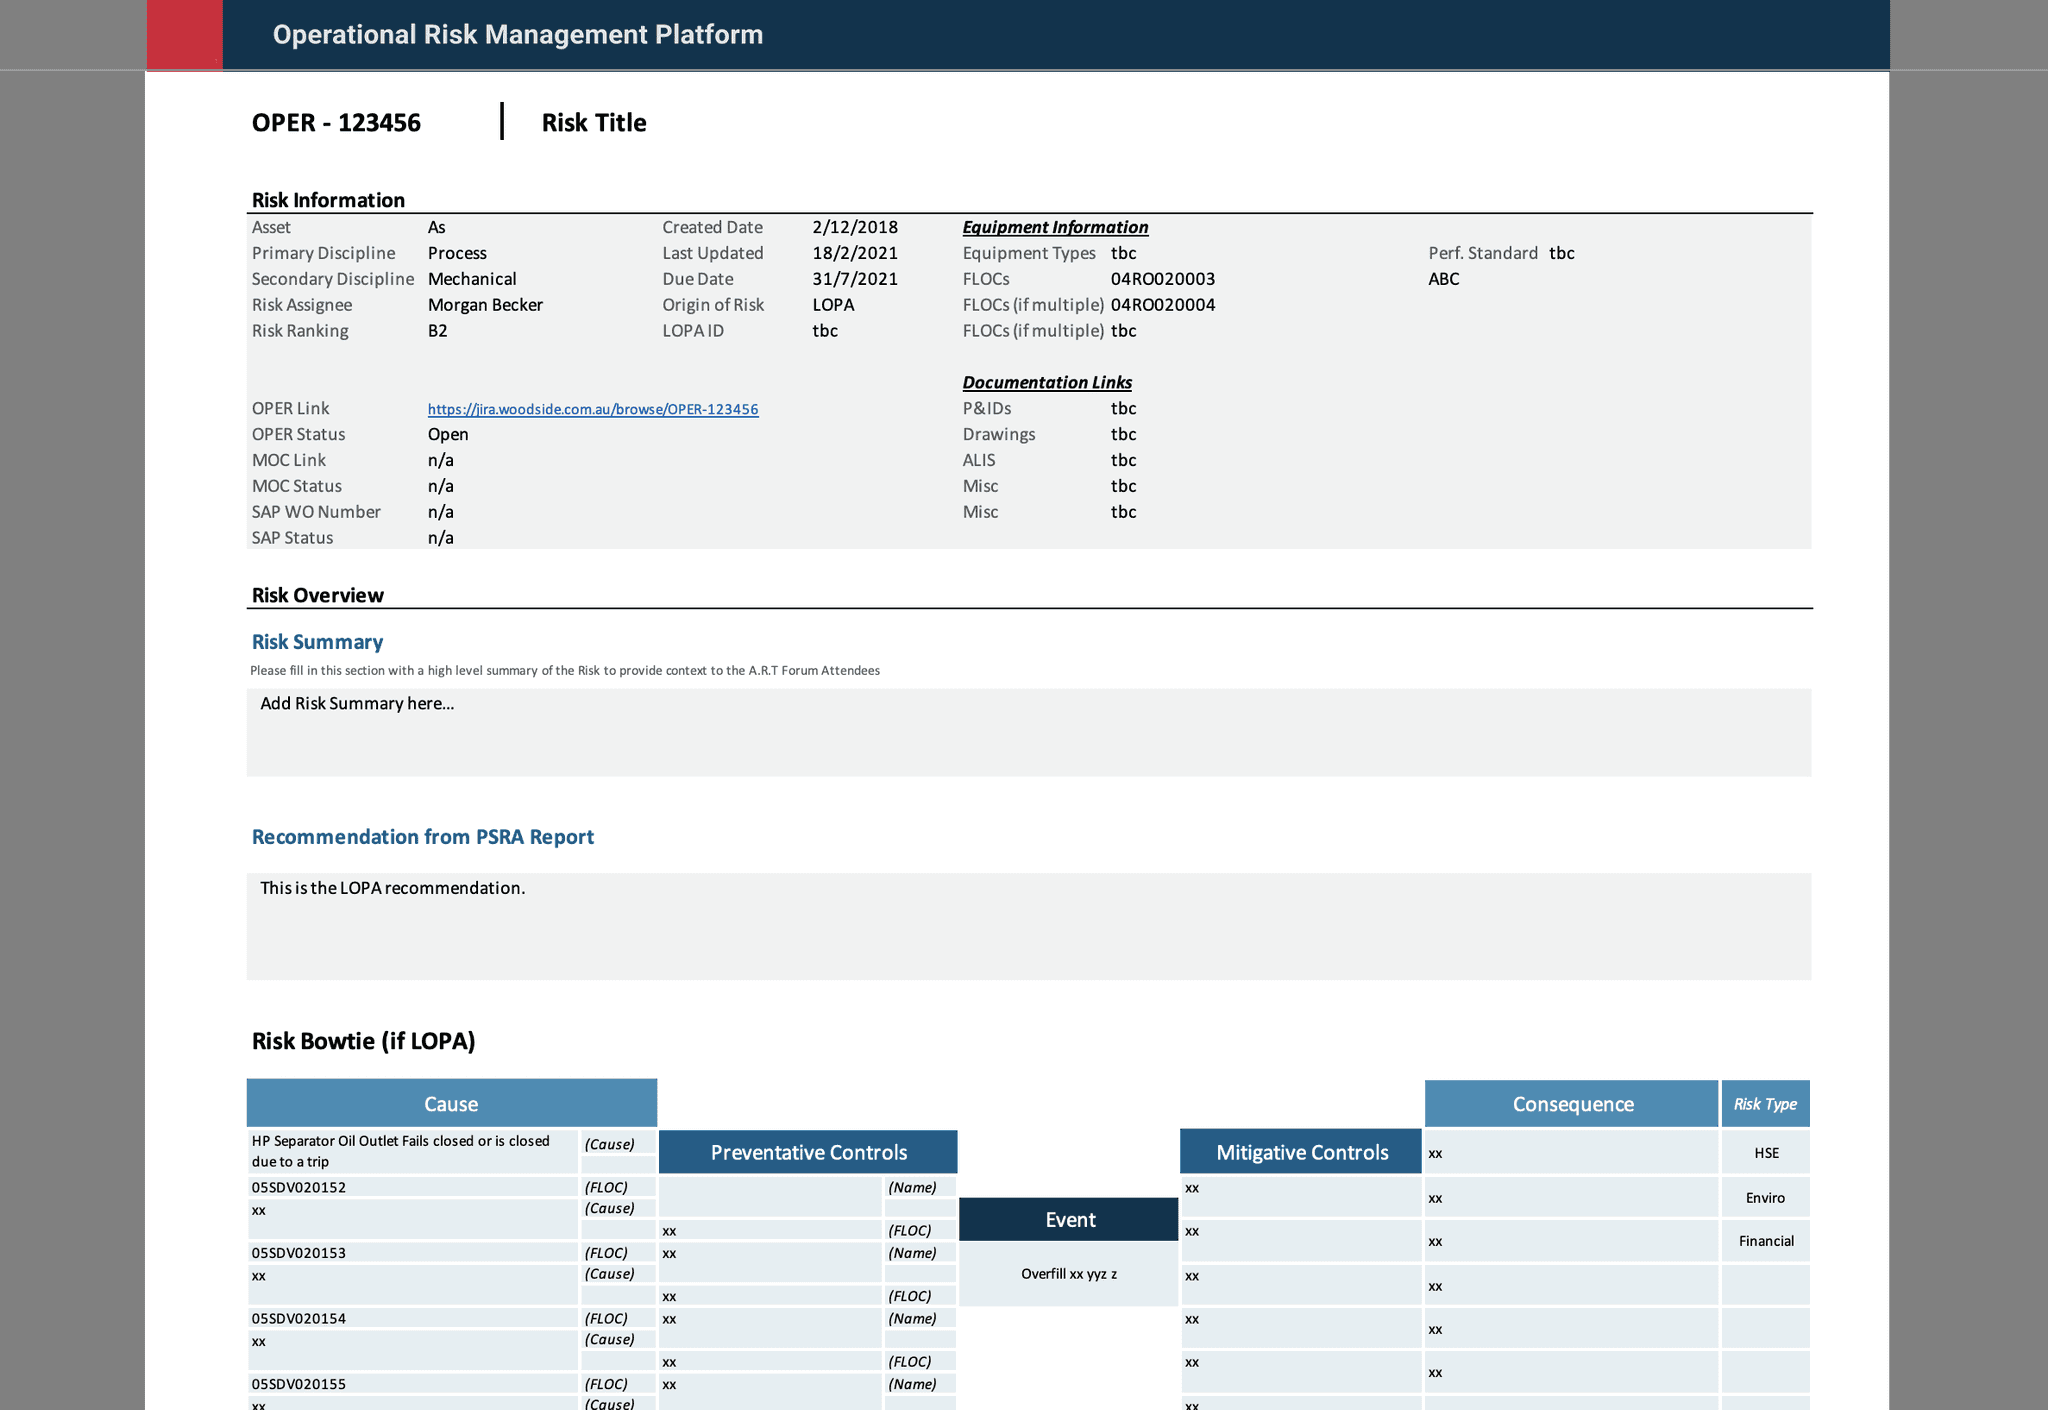
Before the MVP, we tested our product concept with an Excel spreadsheet POC, replicating the app’s flow during real Applied Risk Thinking forums and manually managing actions in Jira. While seamless for users, our team worked behind the scenes to keep everything running smoothly.
In one workshop, we used a Figma prototype, with our SME scribing in edit mode while others viewed in prototype mode, simulating a fully functioning app & gathering authentic user feedback.

Excel Proof of Concept
Outcomes
How did we define success?
To measure success we…
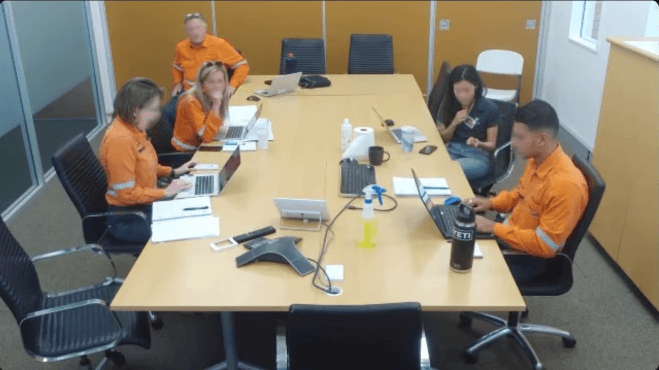
Attended forums to observe decision-making & app use
Conducted surveys
Analysed system data such as time in action status and action outcomes
Conducted time-savings calculations
Interviews and feedback loops from users / champions
Welcome to the Risk Thinking Club…
Just 3 months after releasing the first version of our application, we were able to prevent over $2.6 million dollars from being spent on over 76 ineffective risk management actions.
On top of tangible business benefits, we noticed a drastic shift in language, attitude & confidence in decision making.
Although a major improvement, cultural changes take time so we built in a quarterly routine to review progress.
Merch I created for team morale!
